Graphing Activities for Your Math Groups
Let’s talk about how to teach our students how to analyze data using hands-on learning. In kindergarten, students sort and classify objects. They learn to sort by color, size, and shape. In first grade, students take what they sorted and display their information into data and charts.
They begin to add titles to their graphs, add labels, and discuss what they learned from the data using words such as more, less, fewer, equal, or the same. They also learn how to talk about data by comparing quantities, making predictions, and explain why they think the data looks the way it does.
These lessons are invaluable. They learn how to collect data in different ways. Data can be collected using pictures, tallies, or sticky notes! It also doesn’t matter the orientation of the paper; the information will remain the same. They use counting strategies and addition and subtraction to explain data points. In second grade, they create and interpret pictures and bar graphs, so these activities prepare them for what’s next.
Here are some hands-on activities you can use to teach or provide practice in representing and interpreting data.
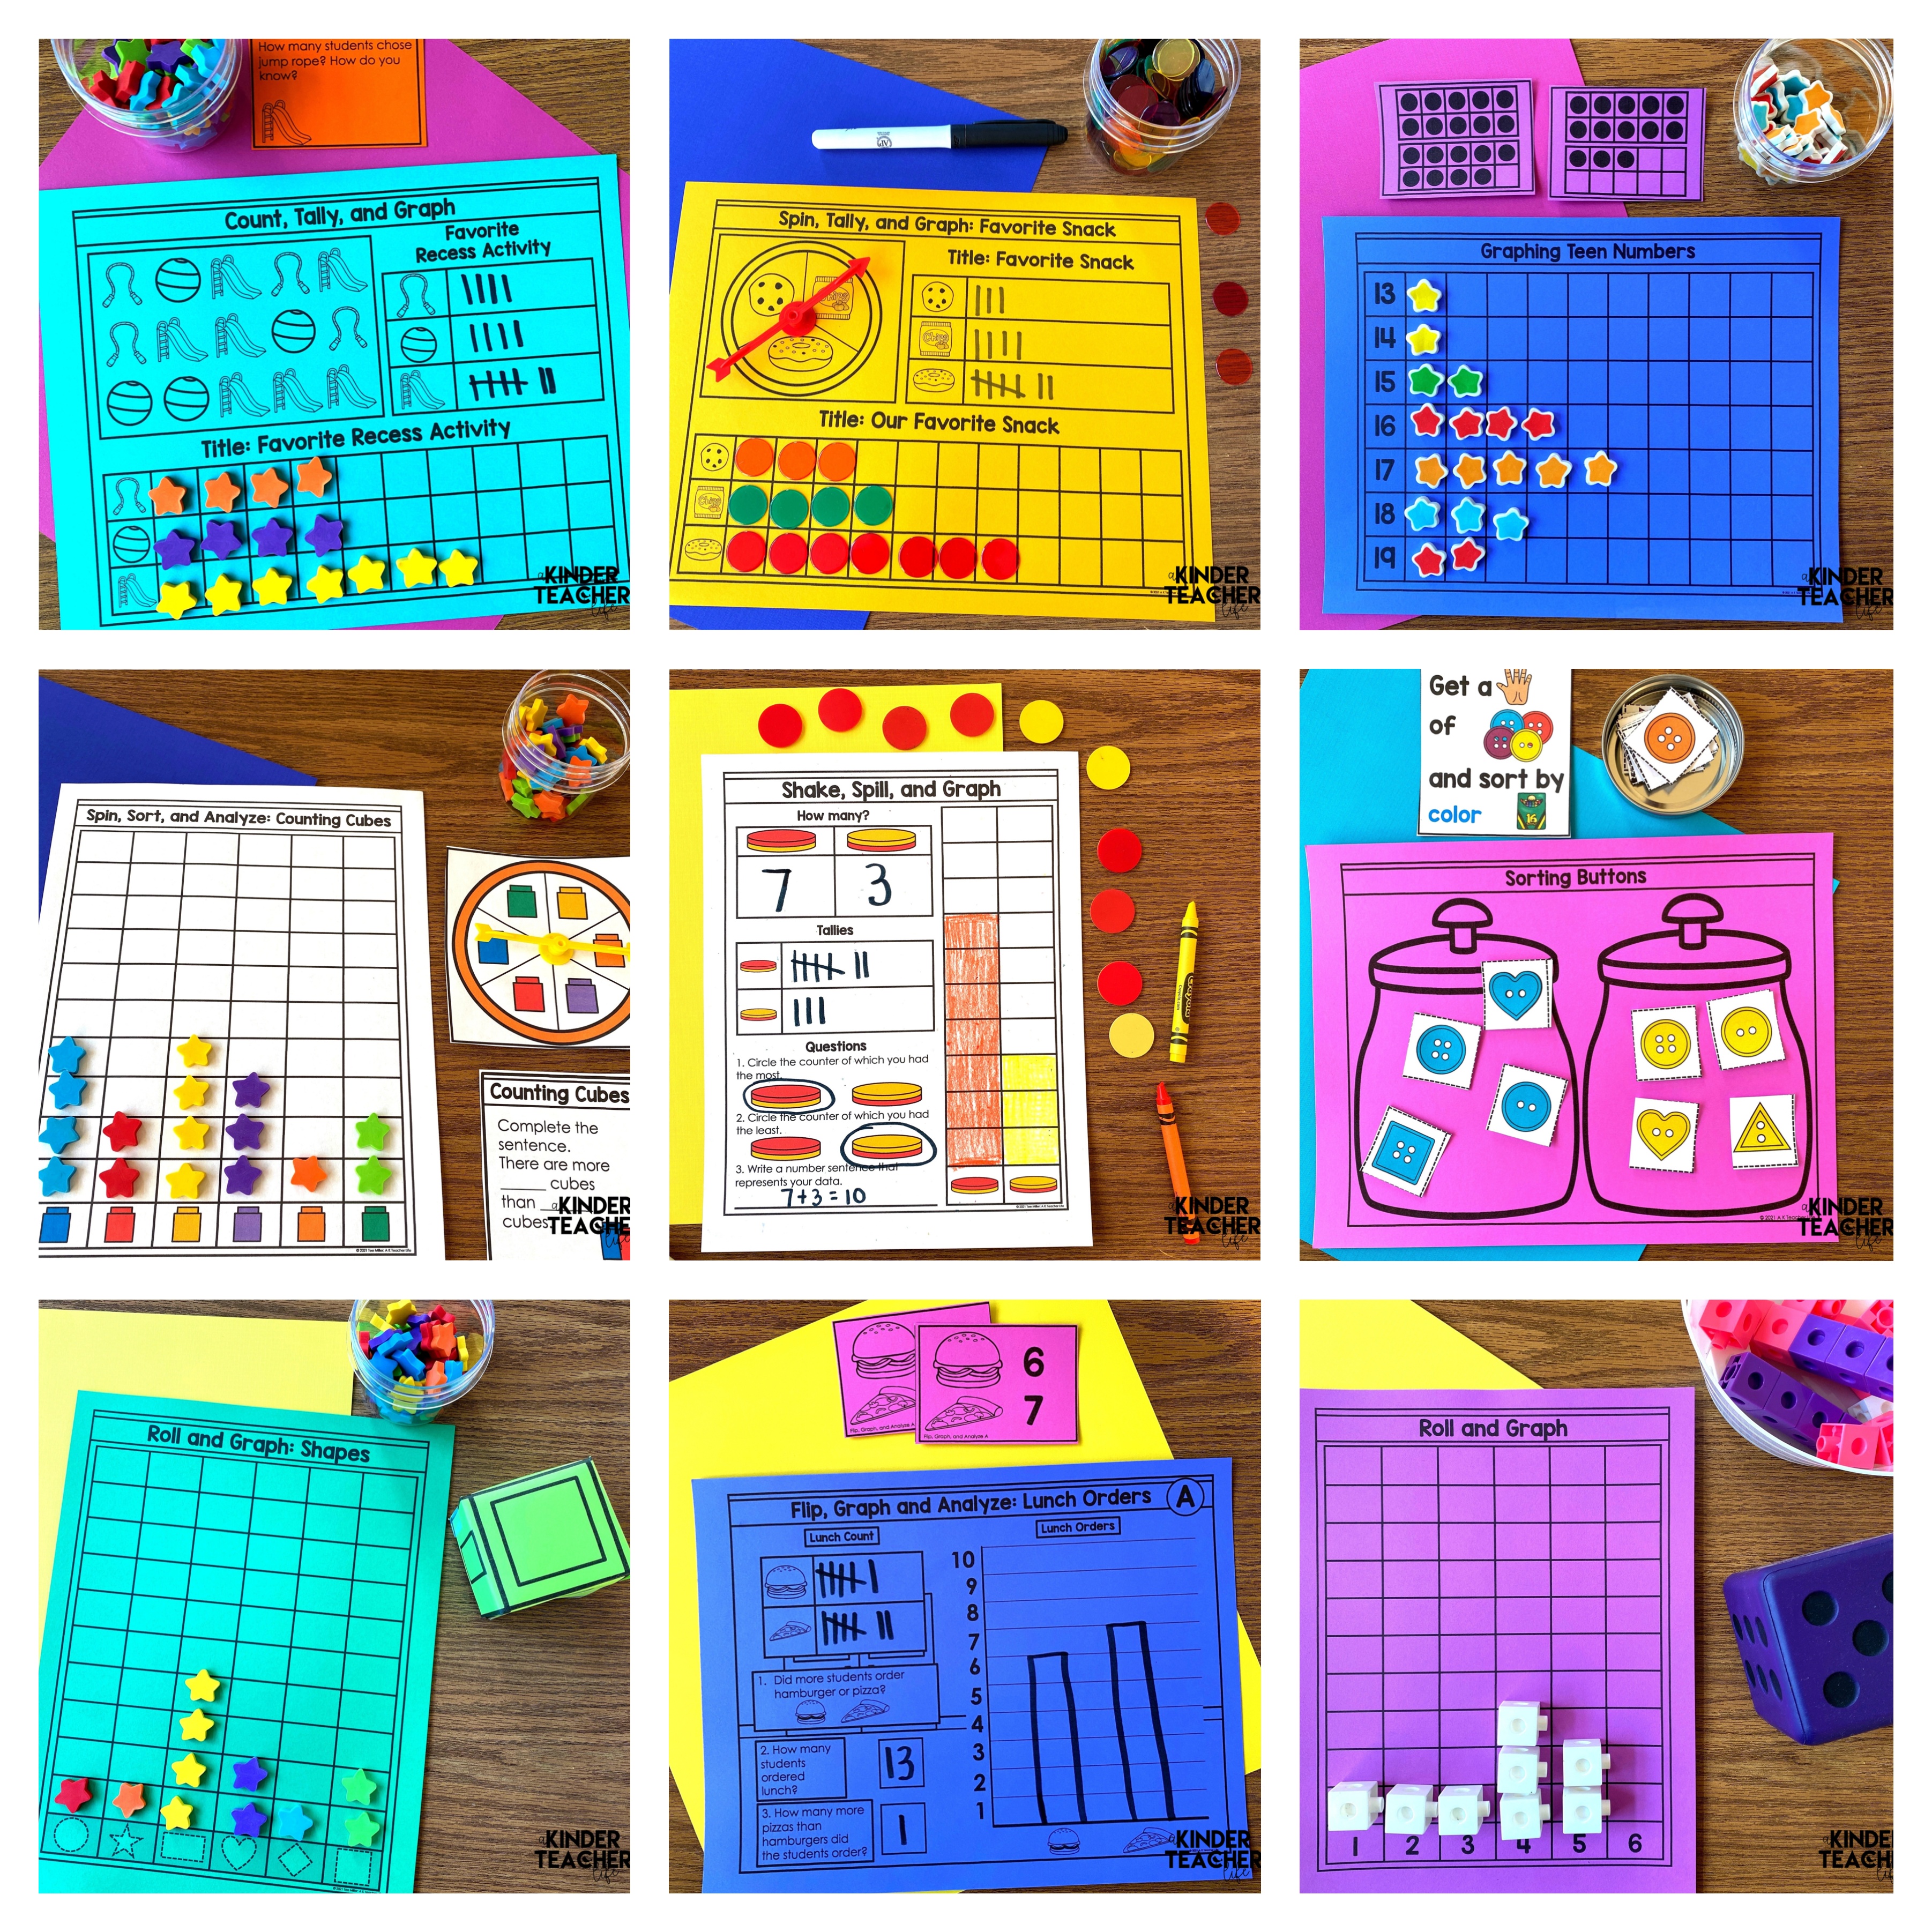
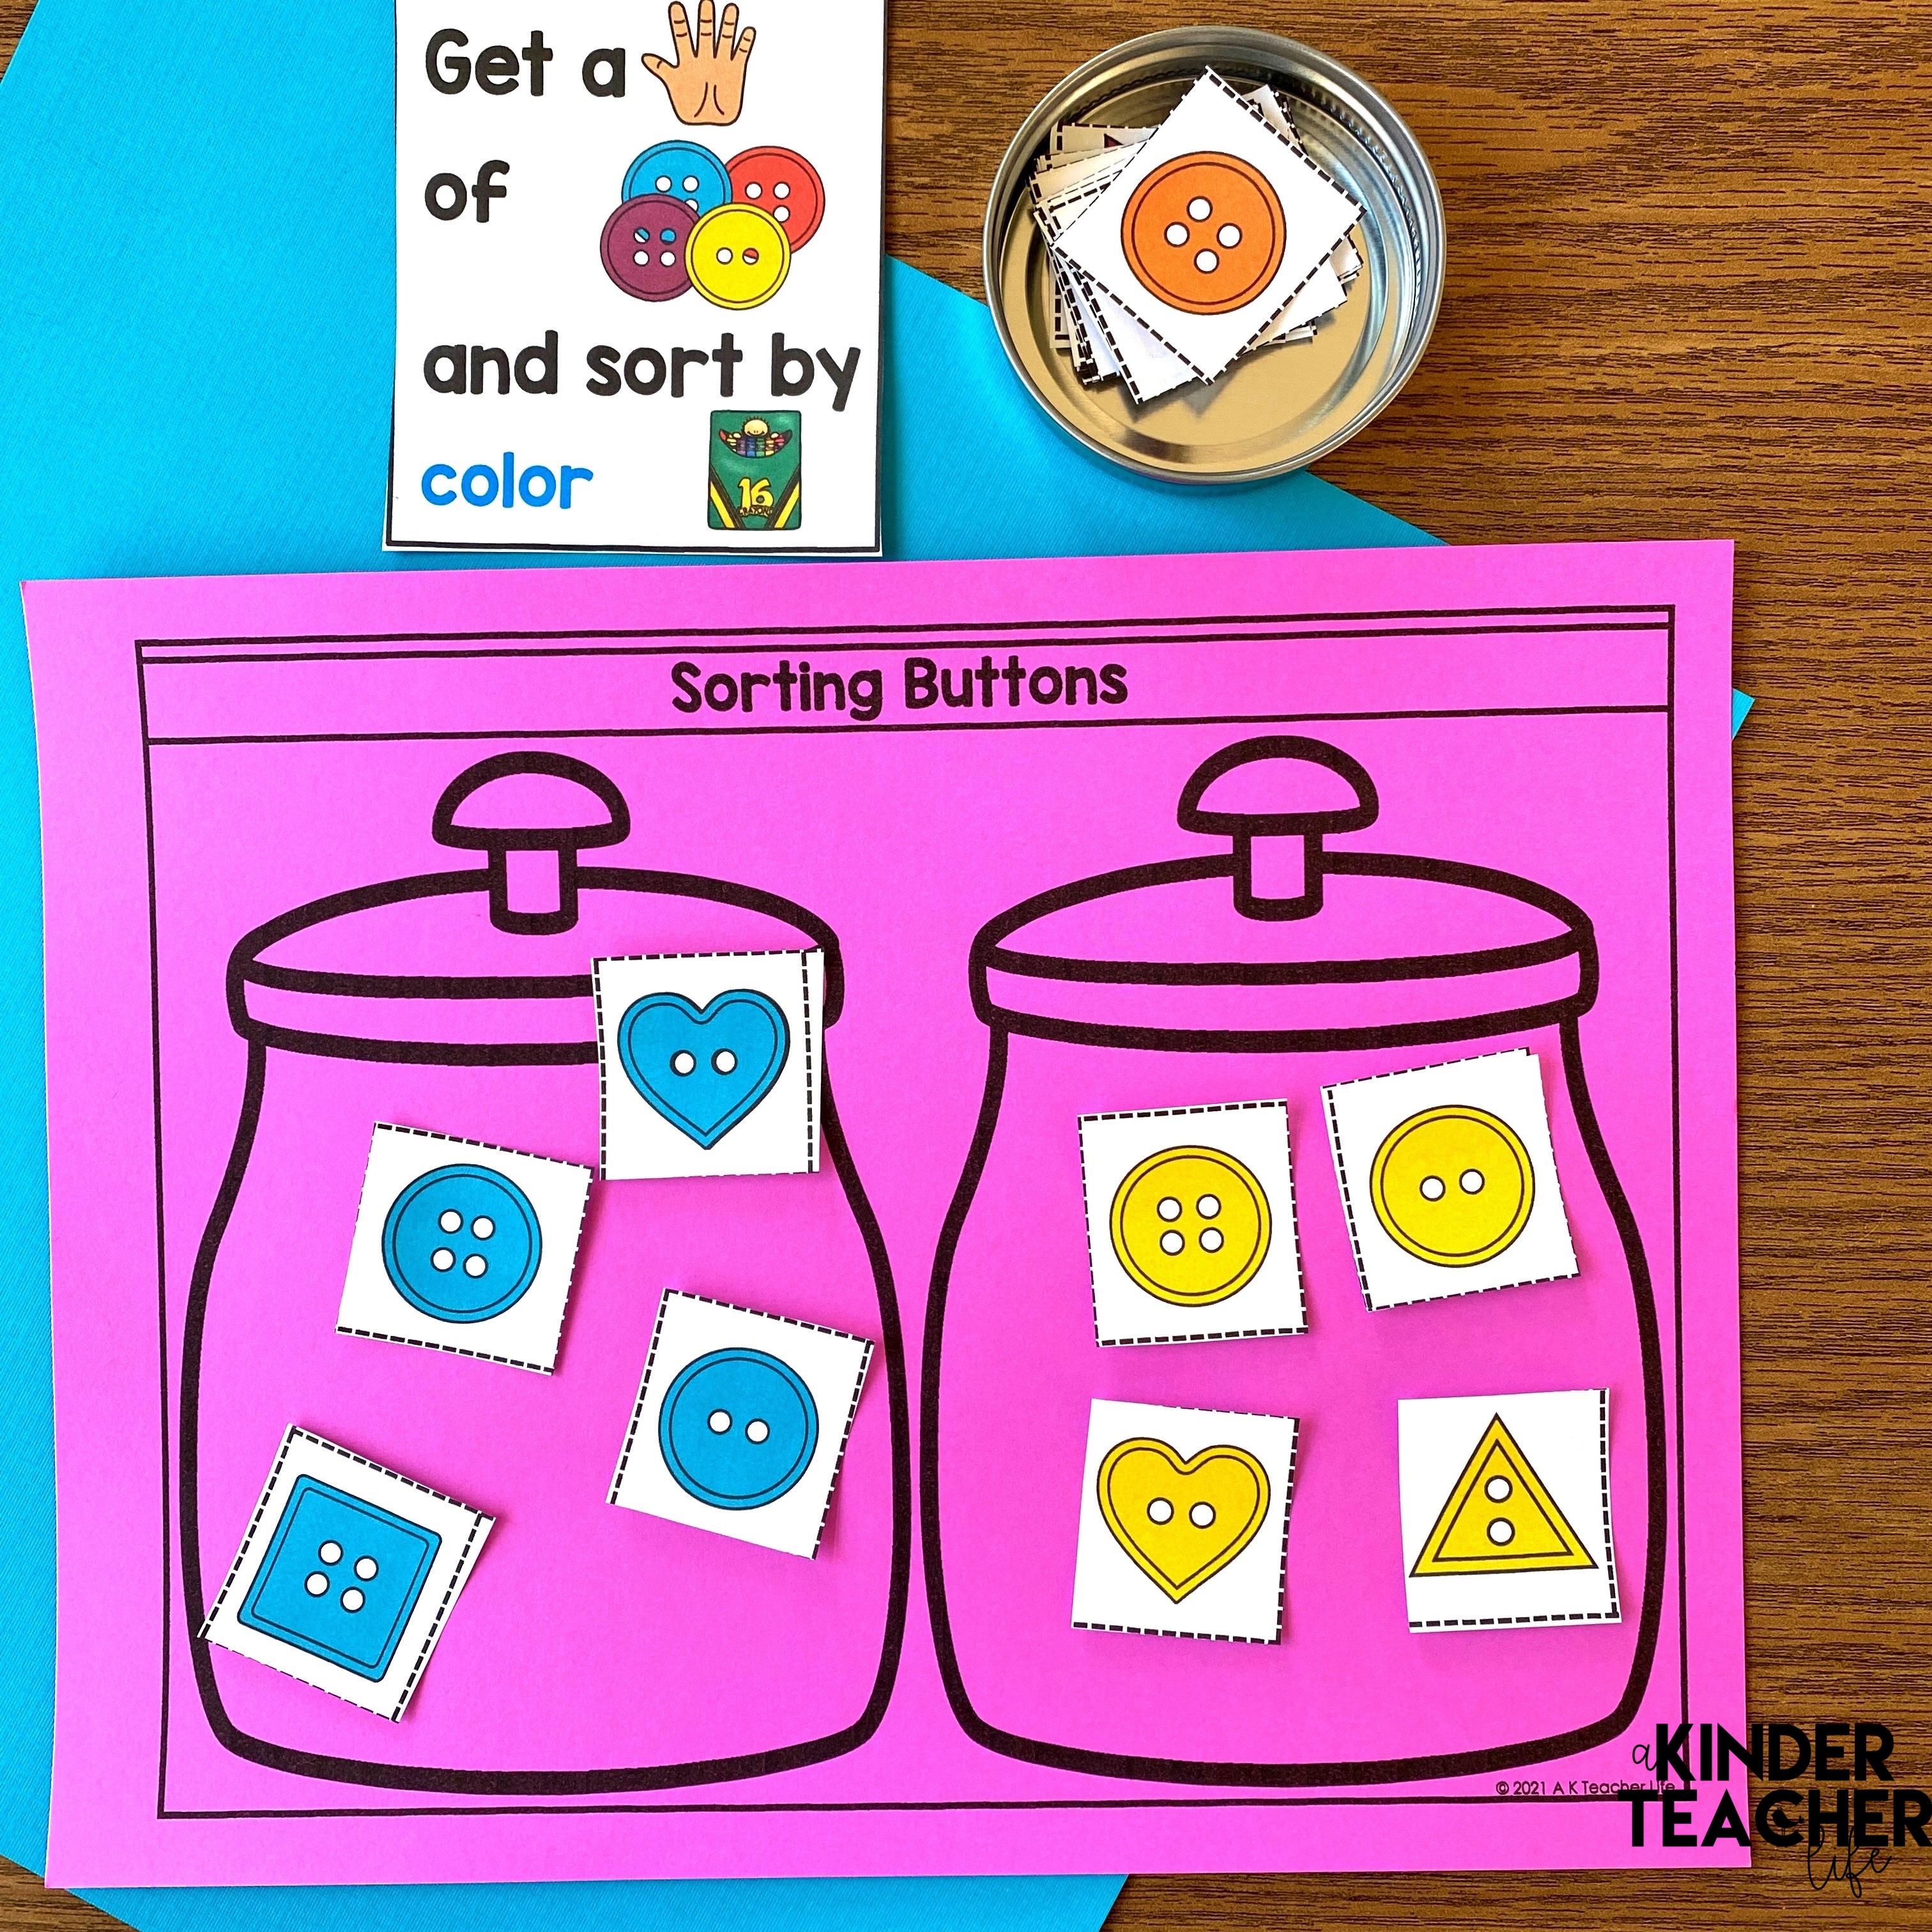
Button Sorting Task Cards
Pick a task card and sort buttons according to the rule.
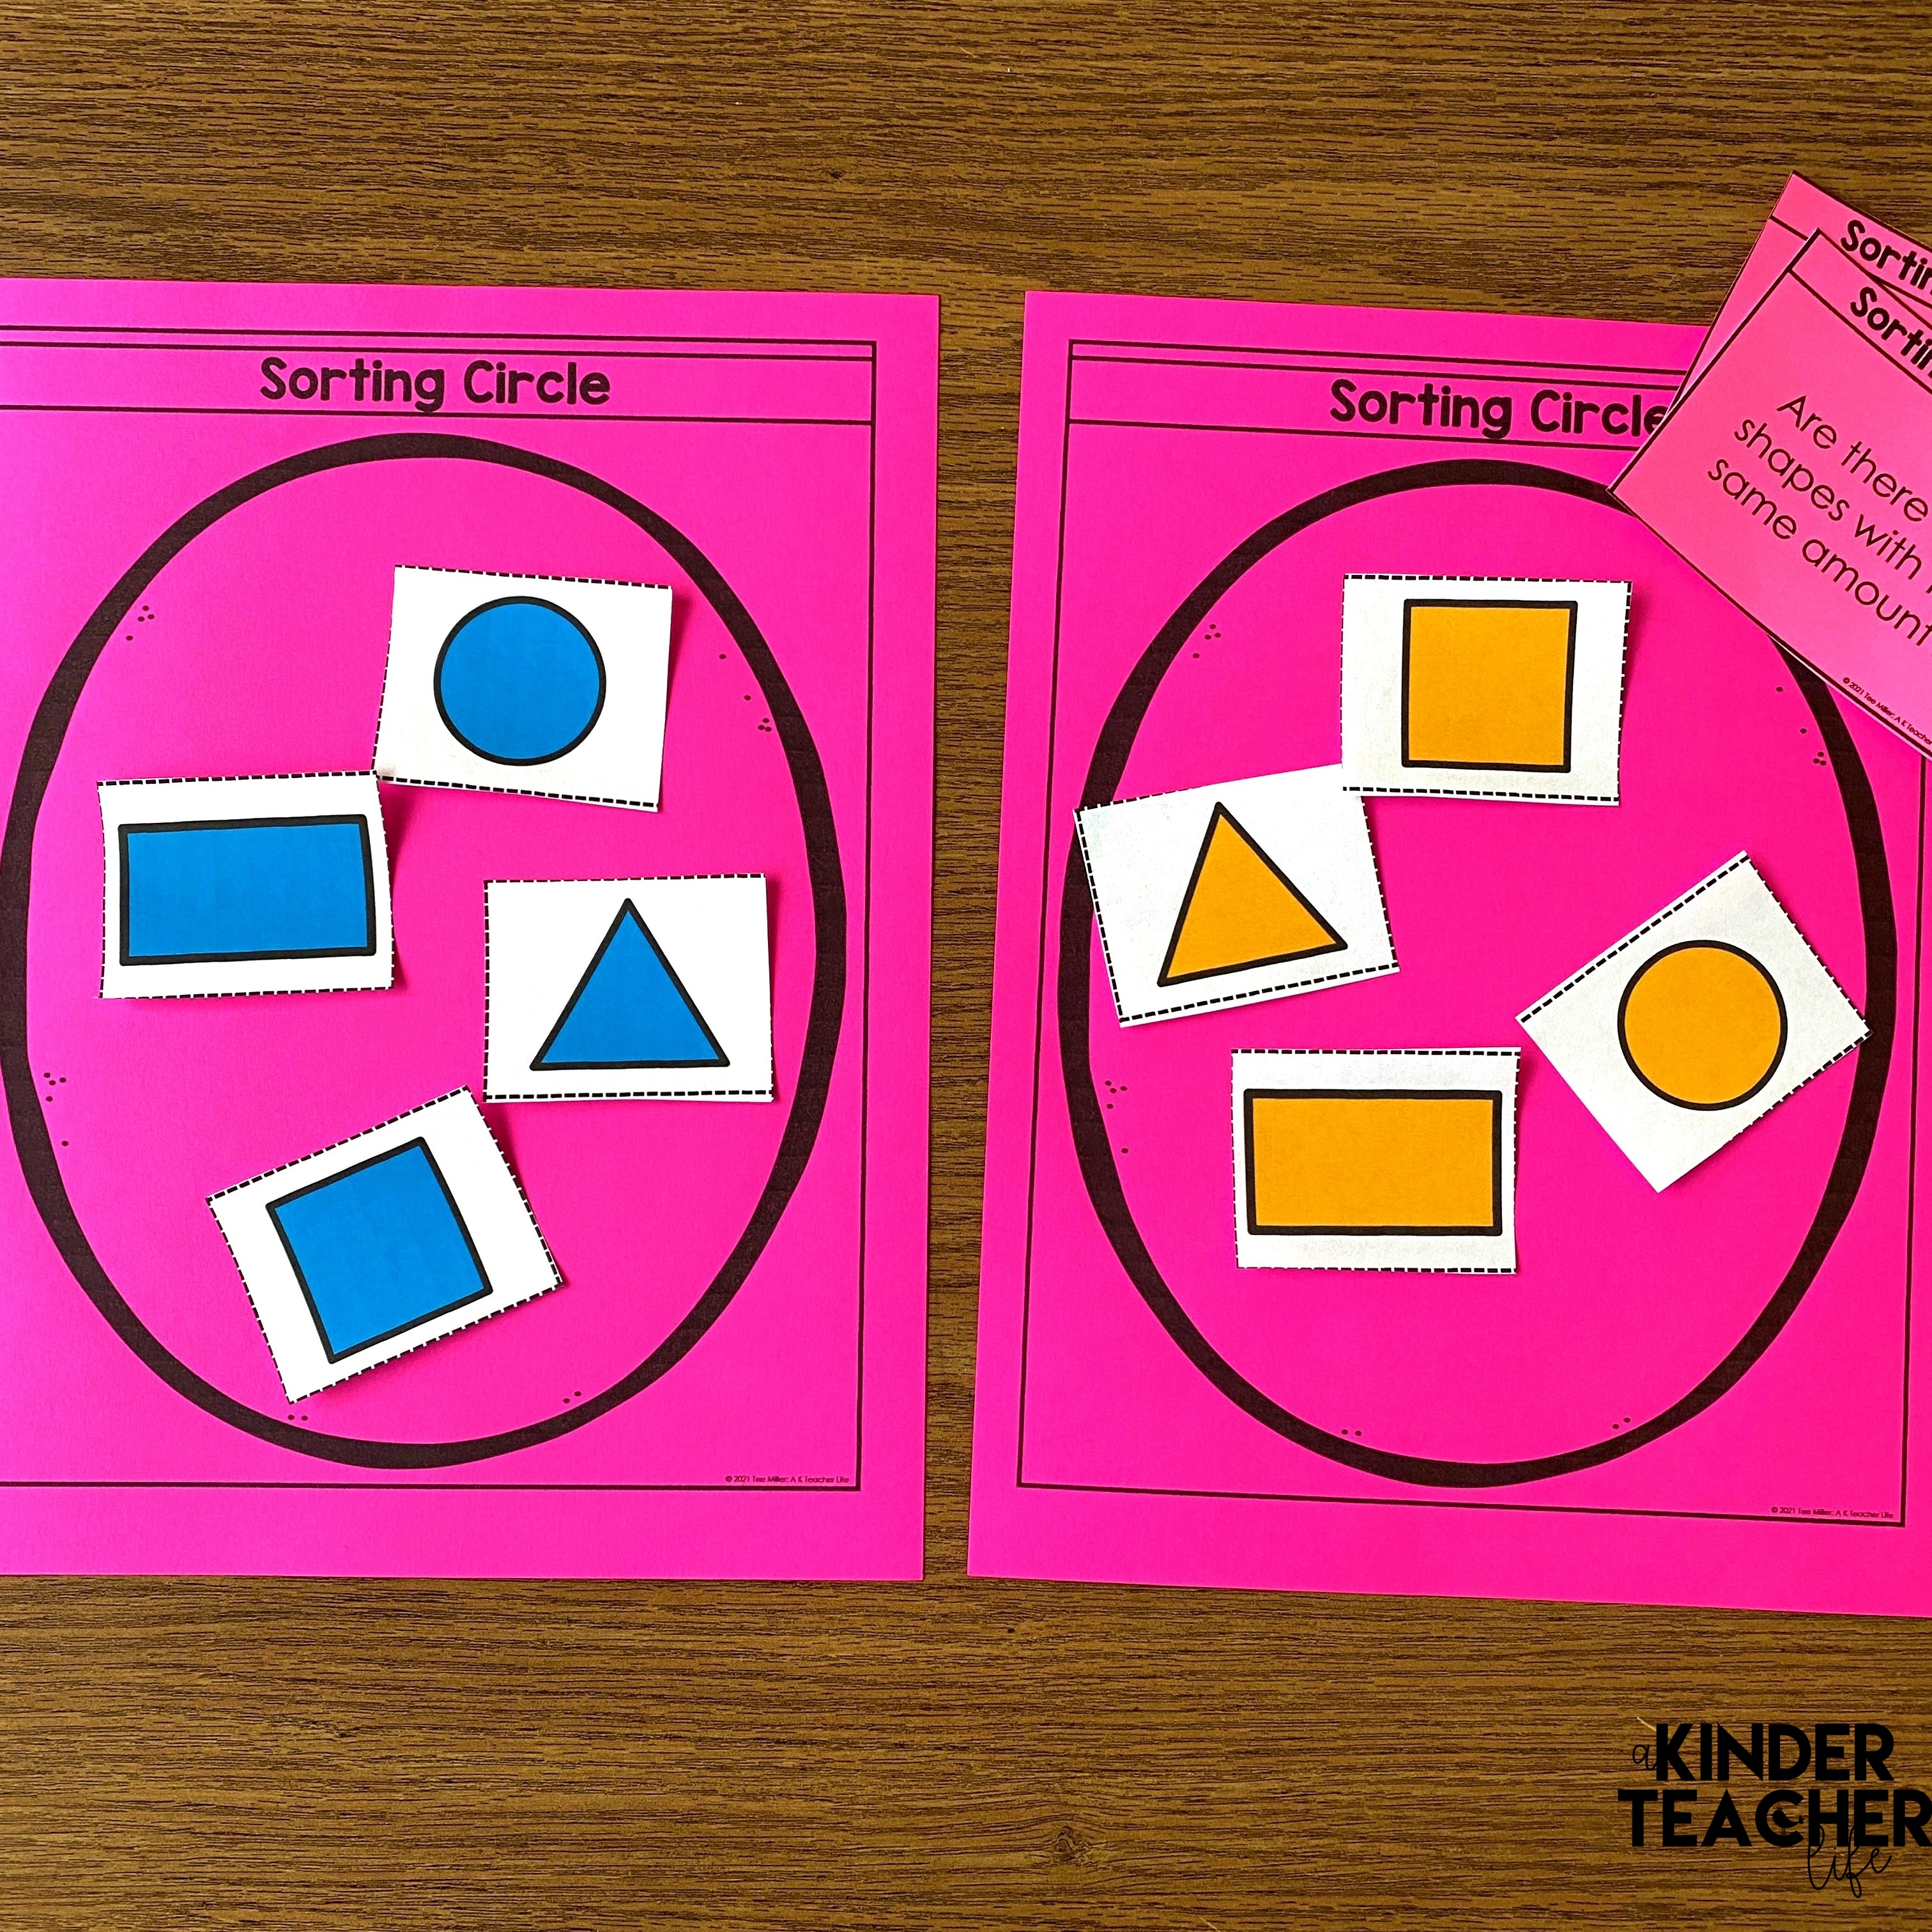
Sorting Circle
Sort shapes by color, shape, or size.
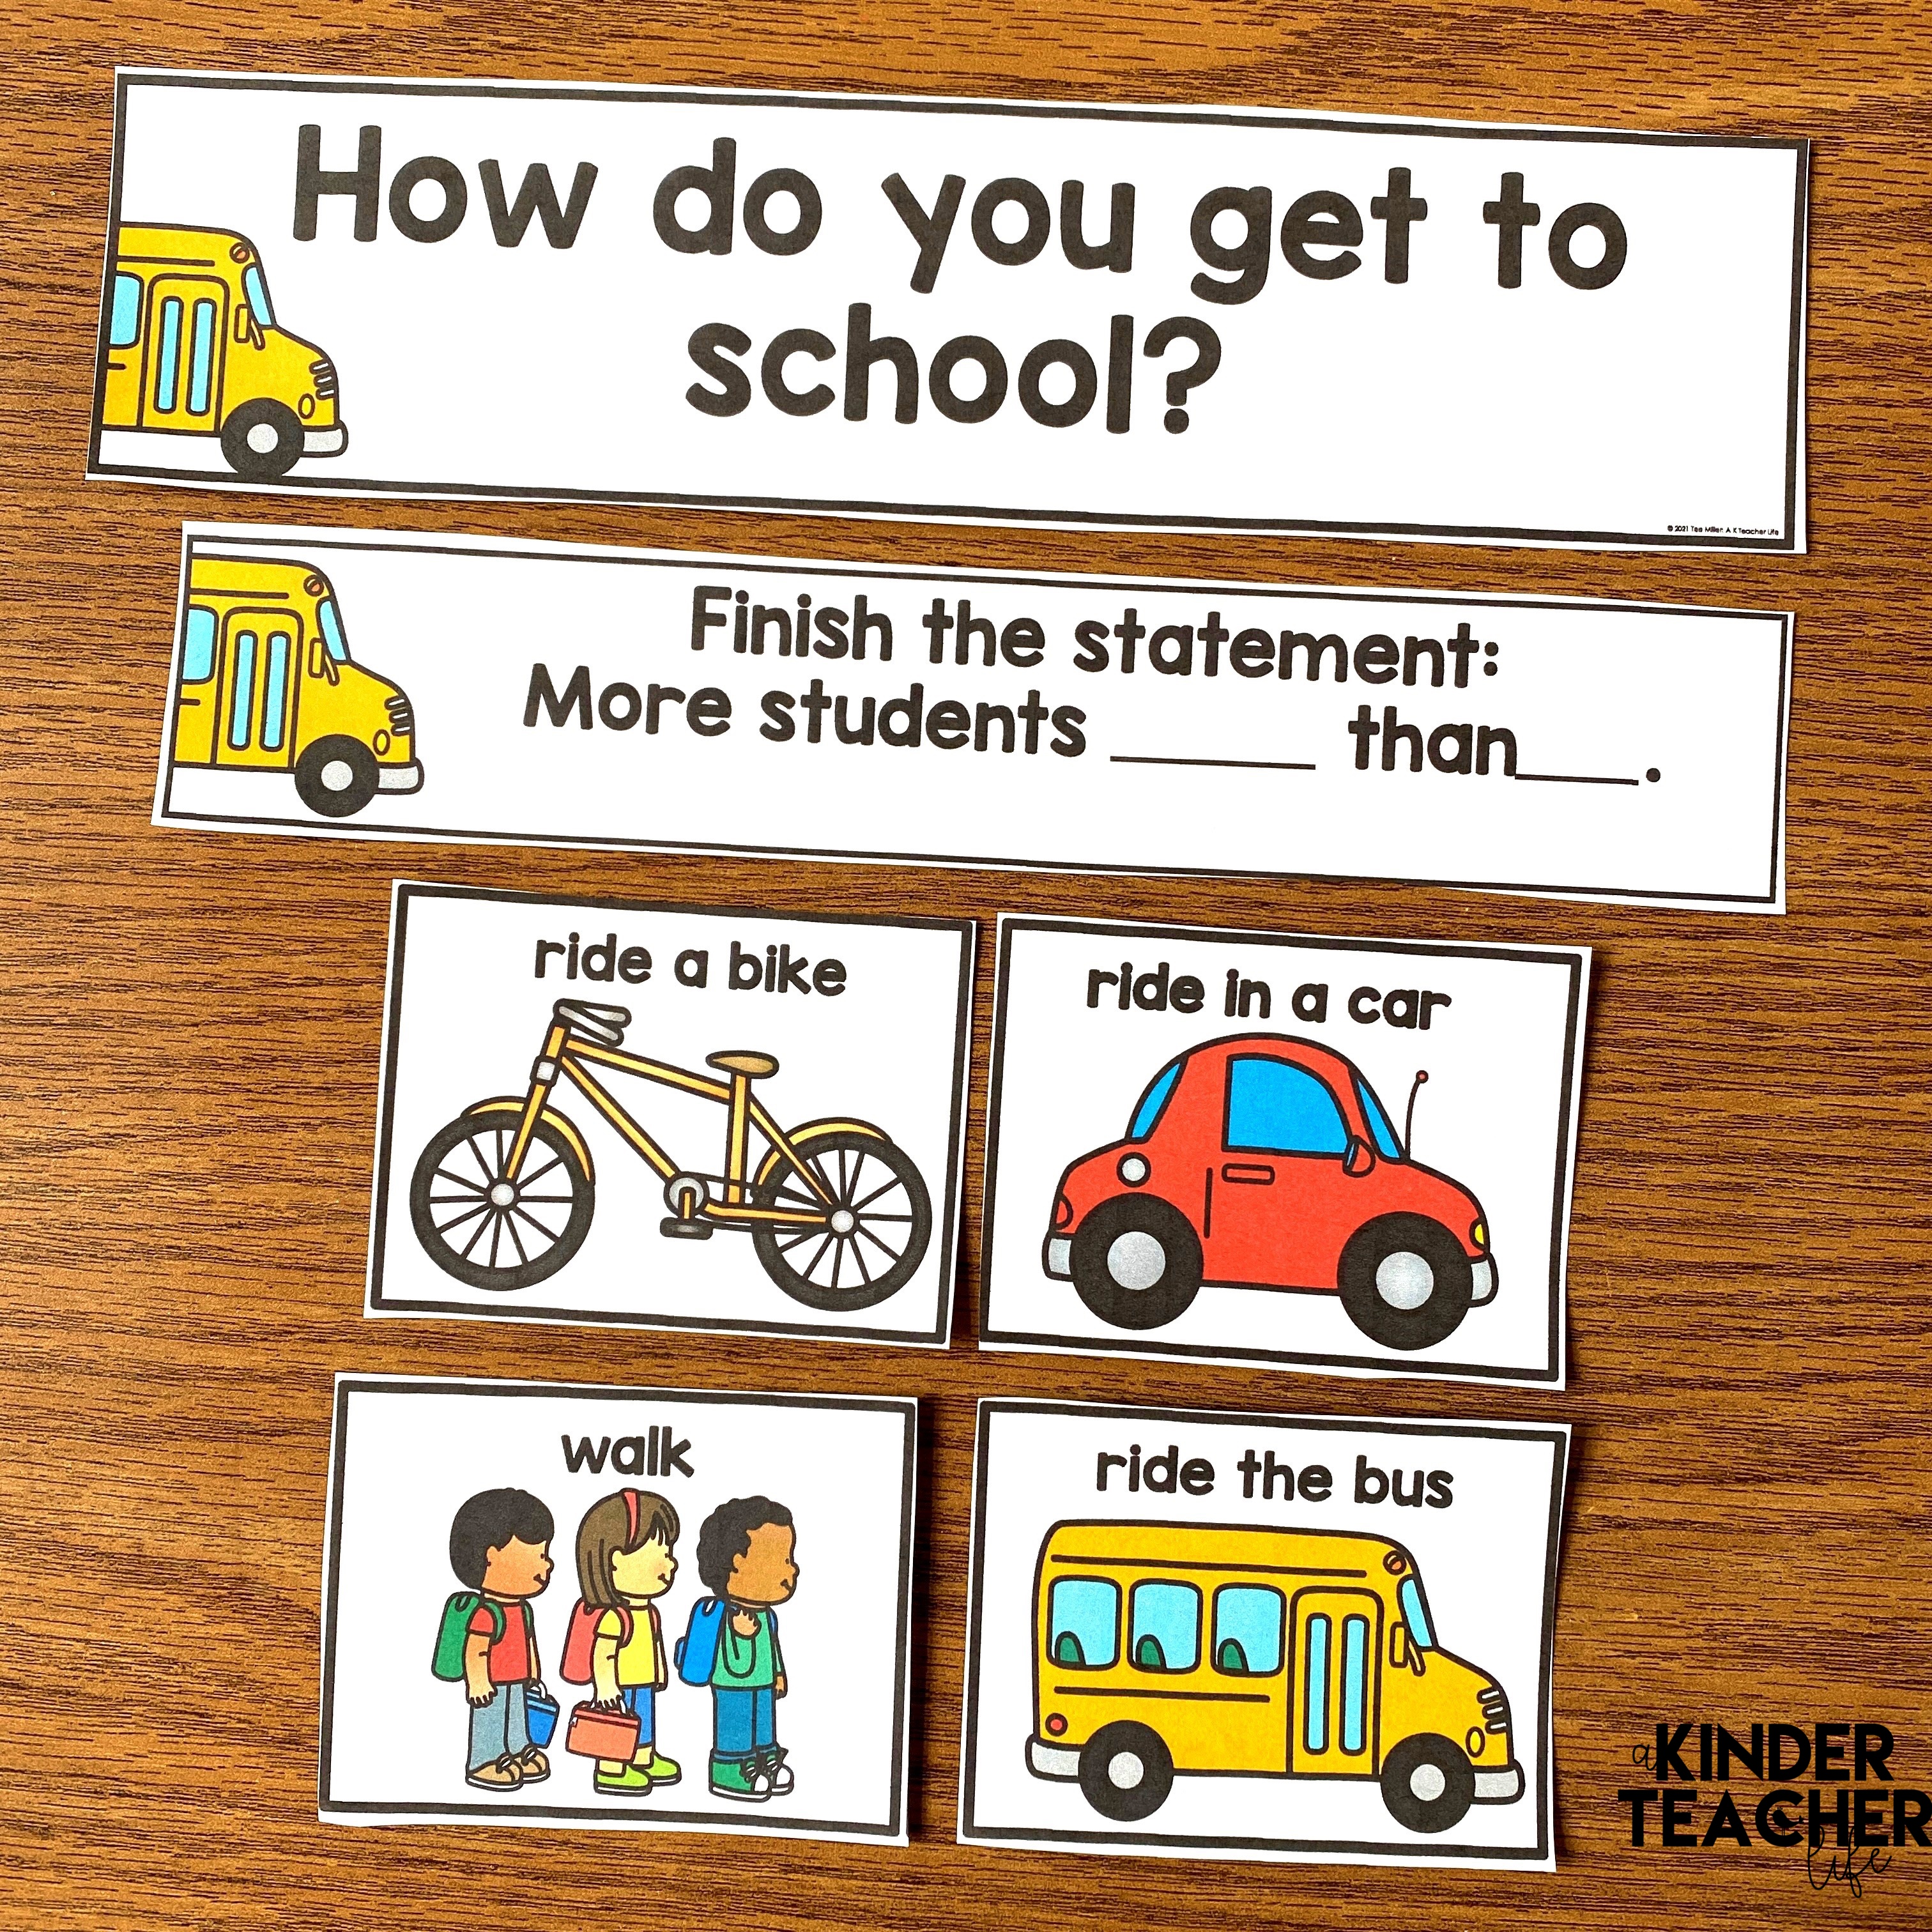
Daily Questions
Ask students a question daily and analyze the data collected.
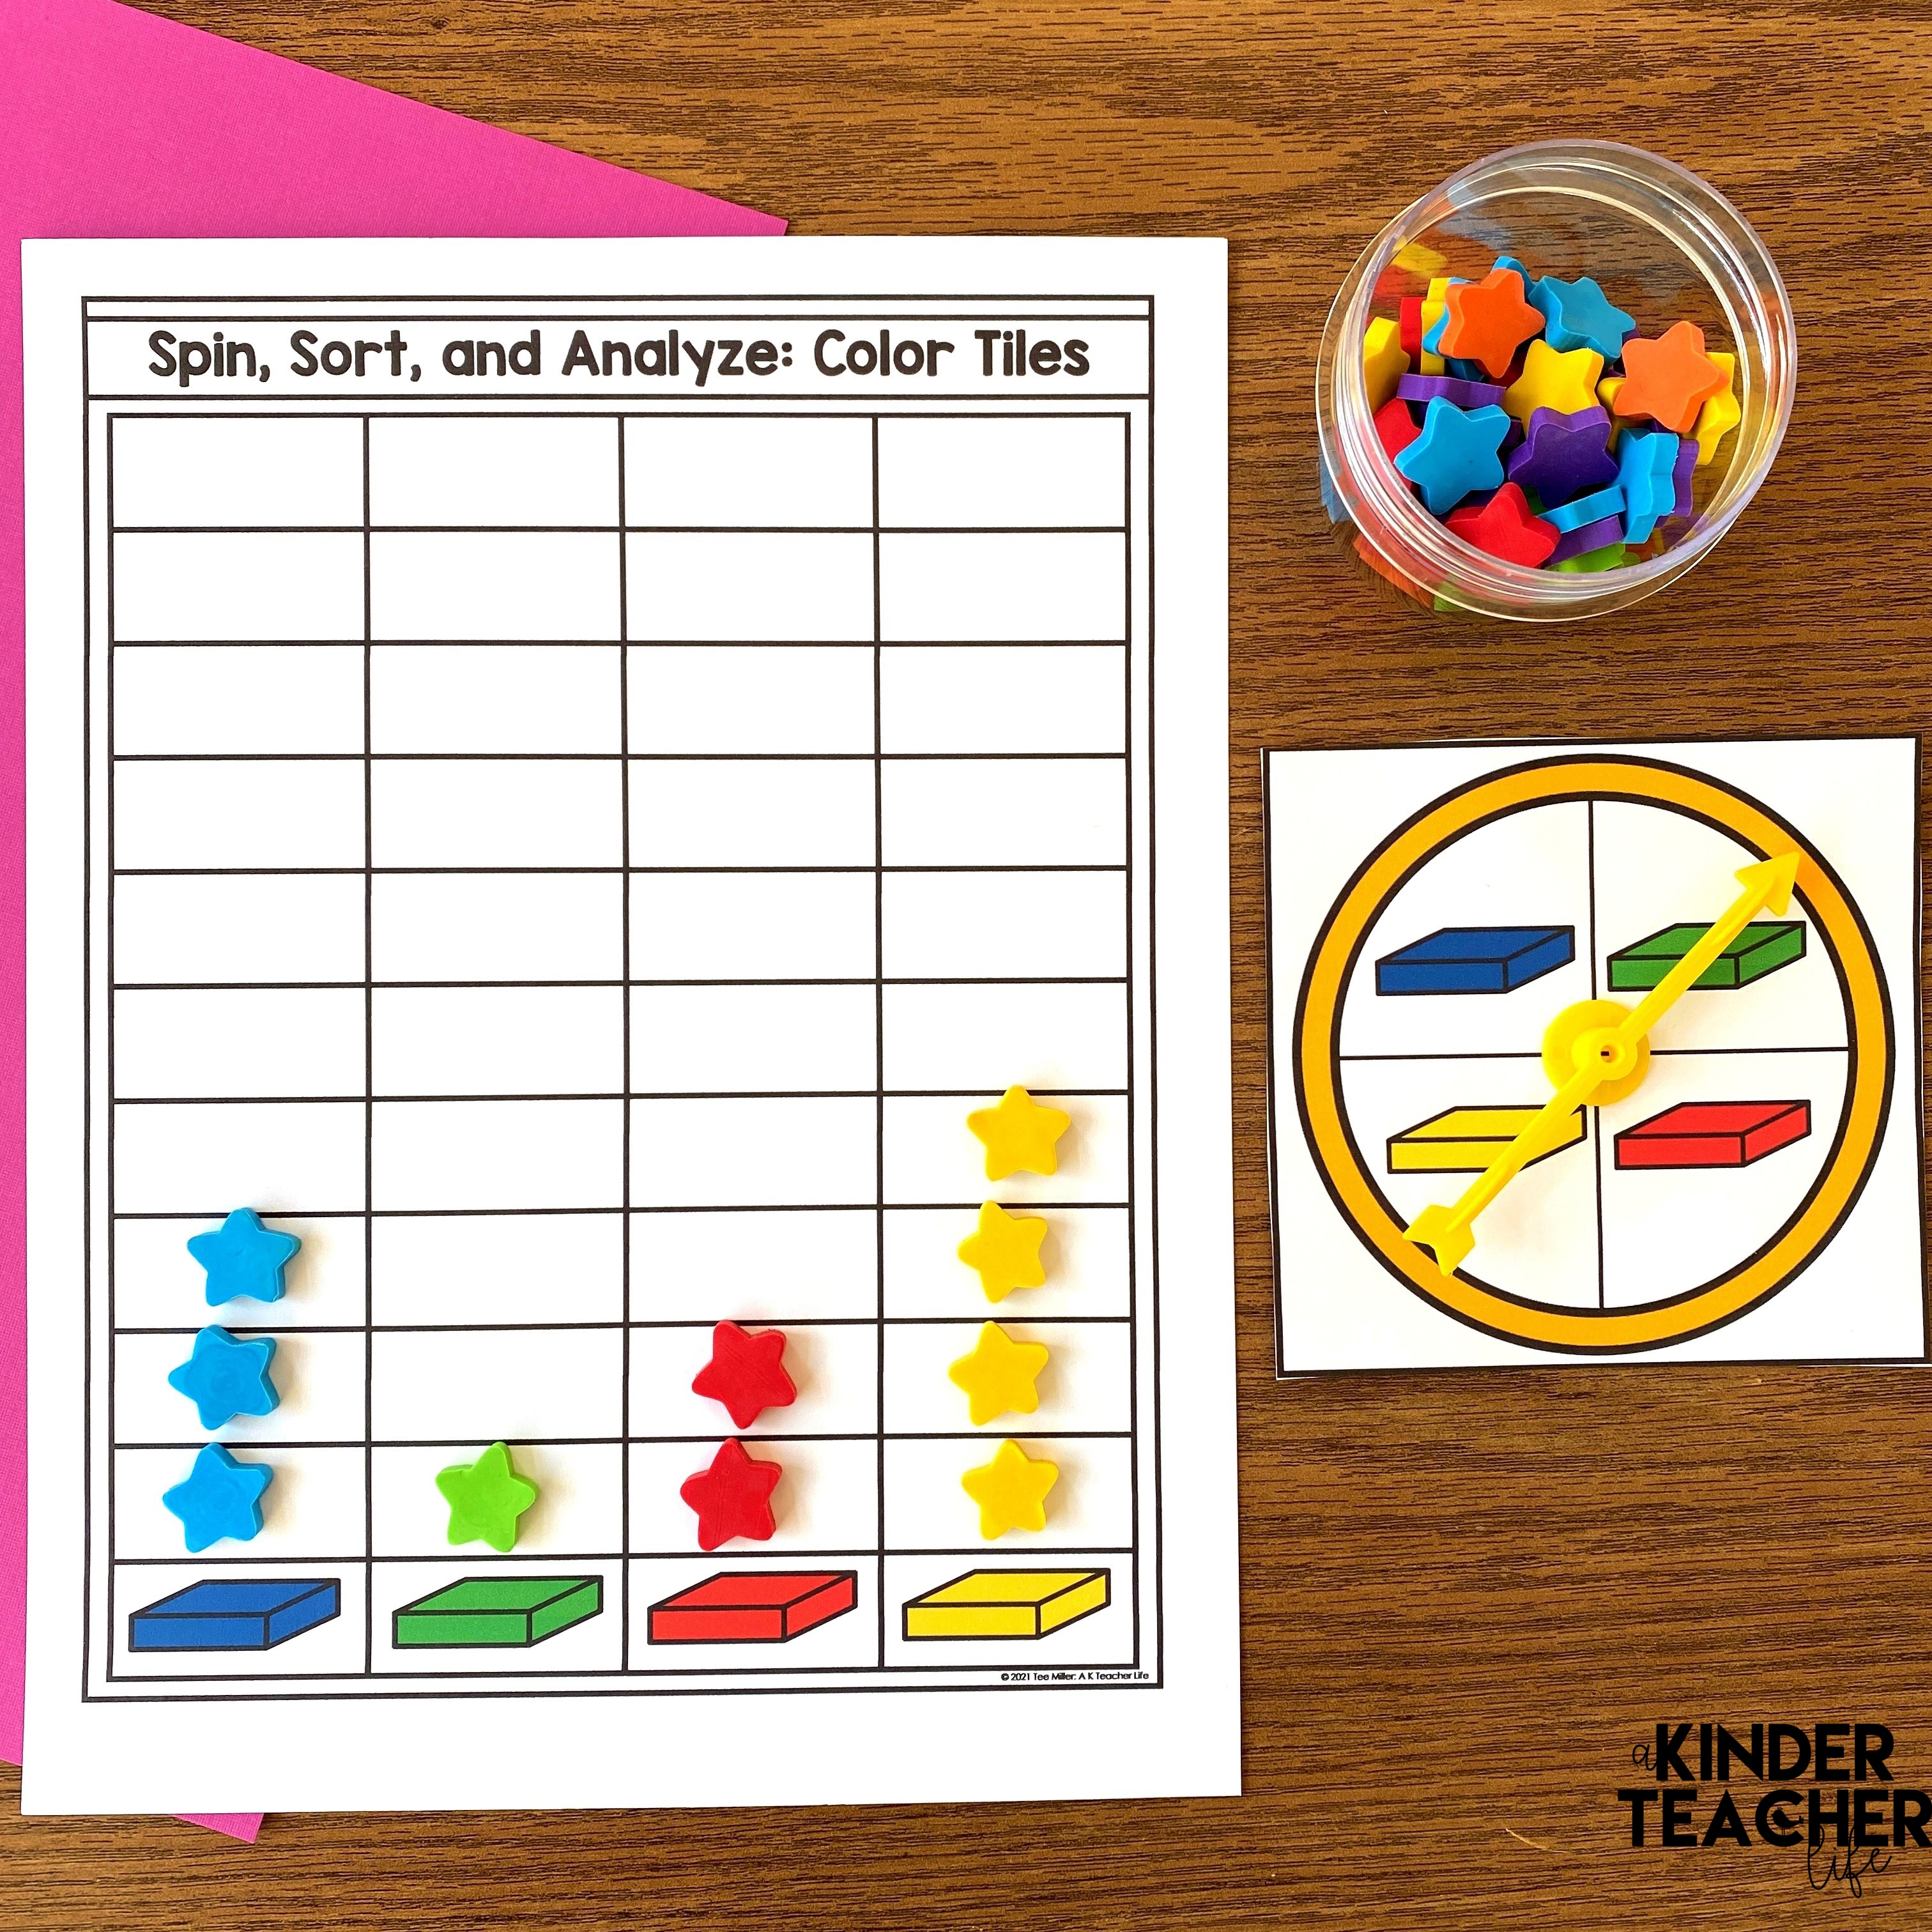
Spin, Sort, and Analyze
Analyze data collected using color tiles.
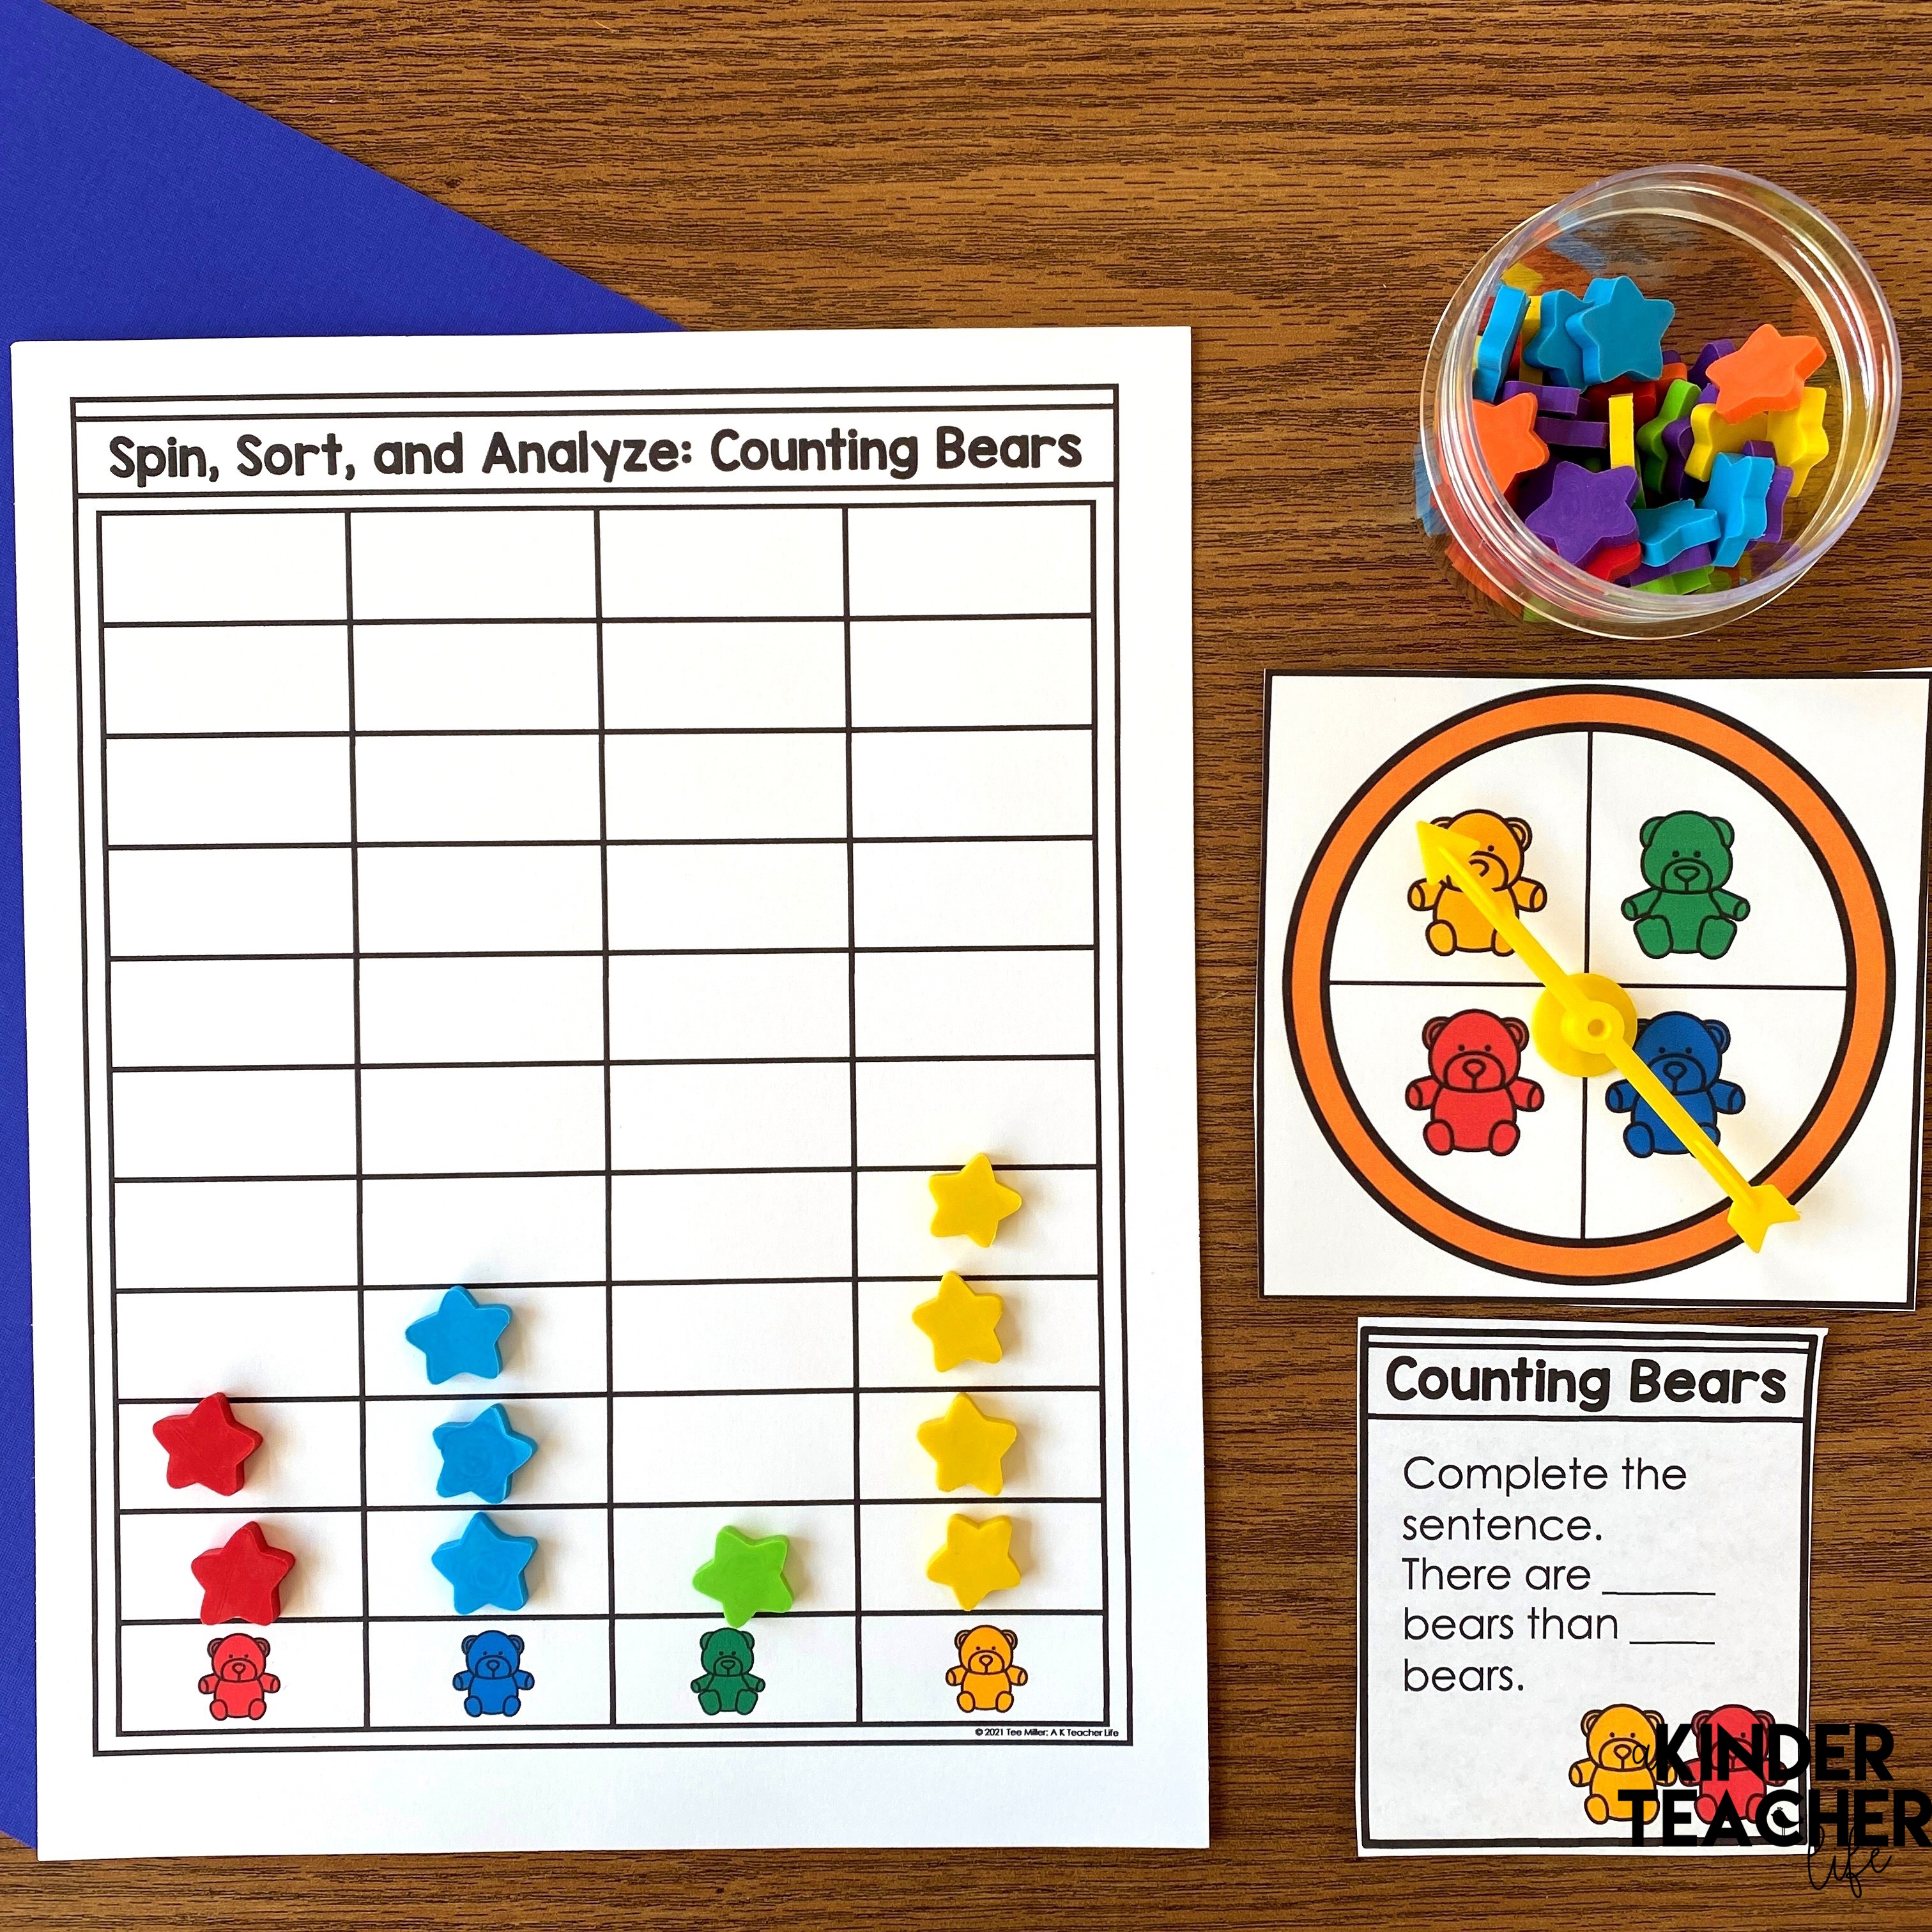
Spin, Sort, and Analyze – Counting Bears
Analyze data collected using counting bears.
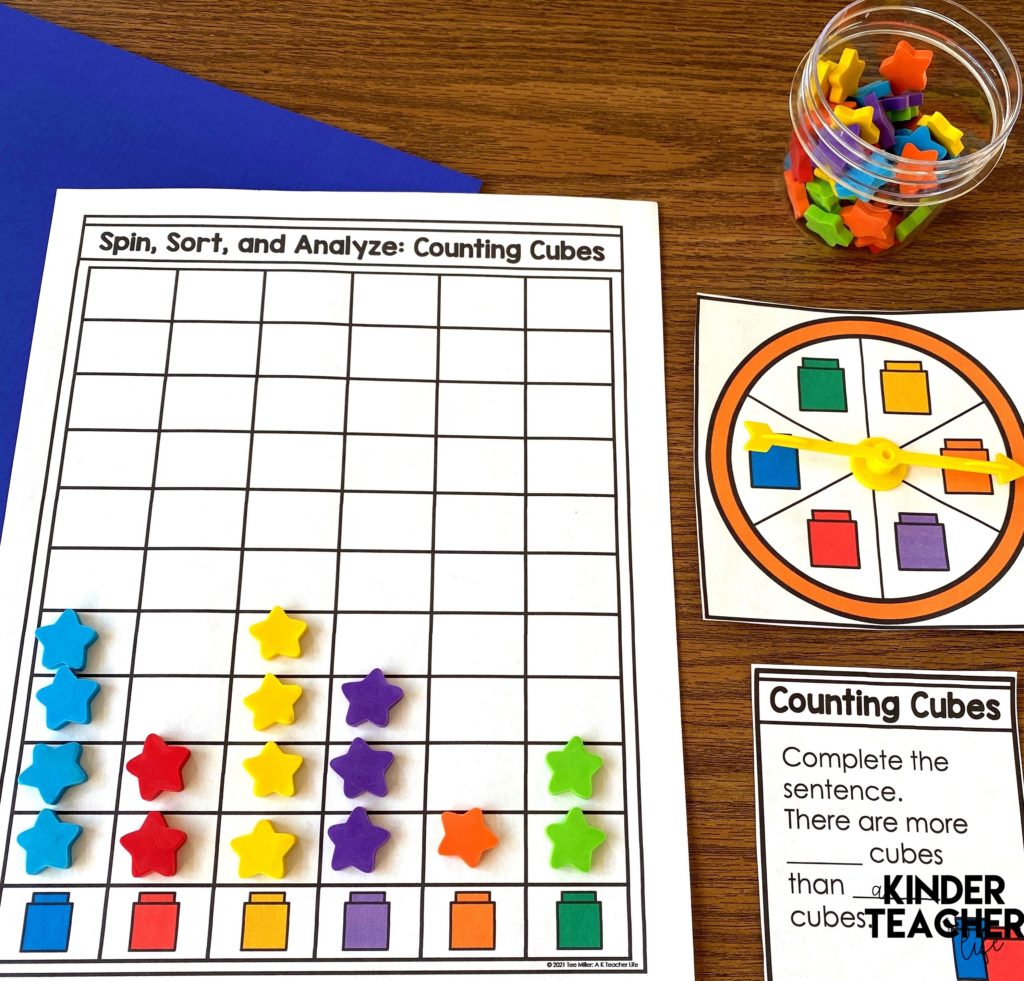
Spin, Sort, and Analyze – Counting Cubes
Analyze data collected using counting cubes.
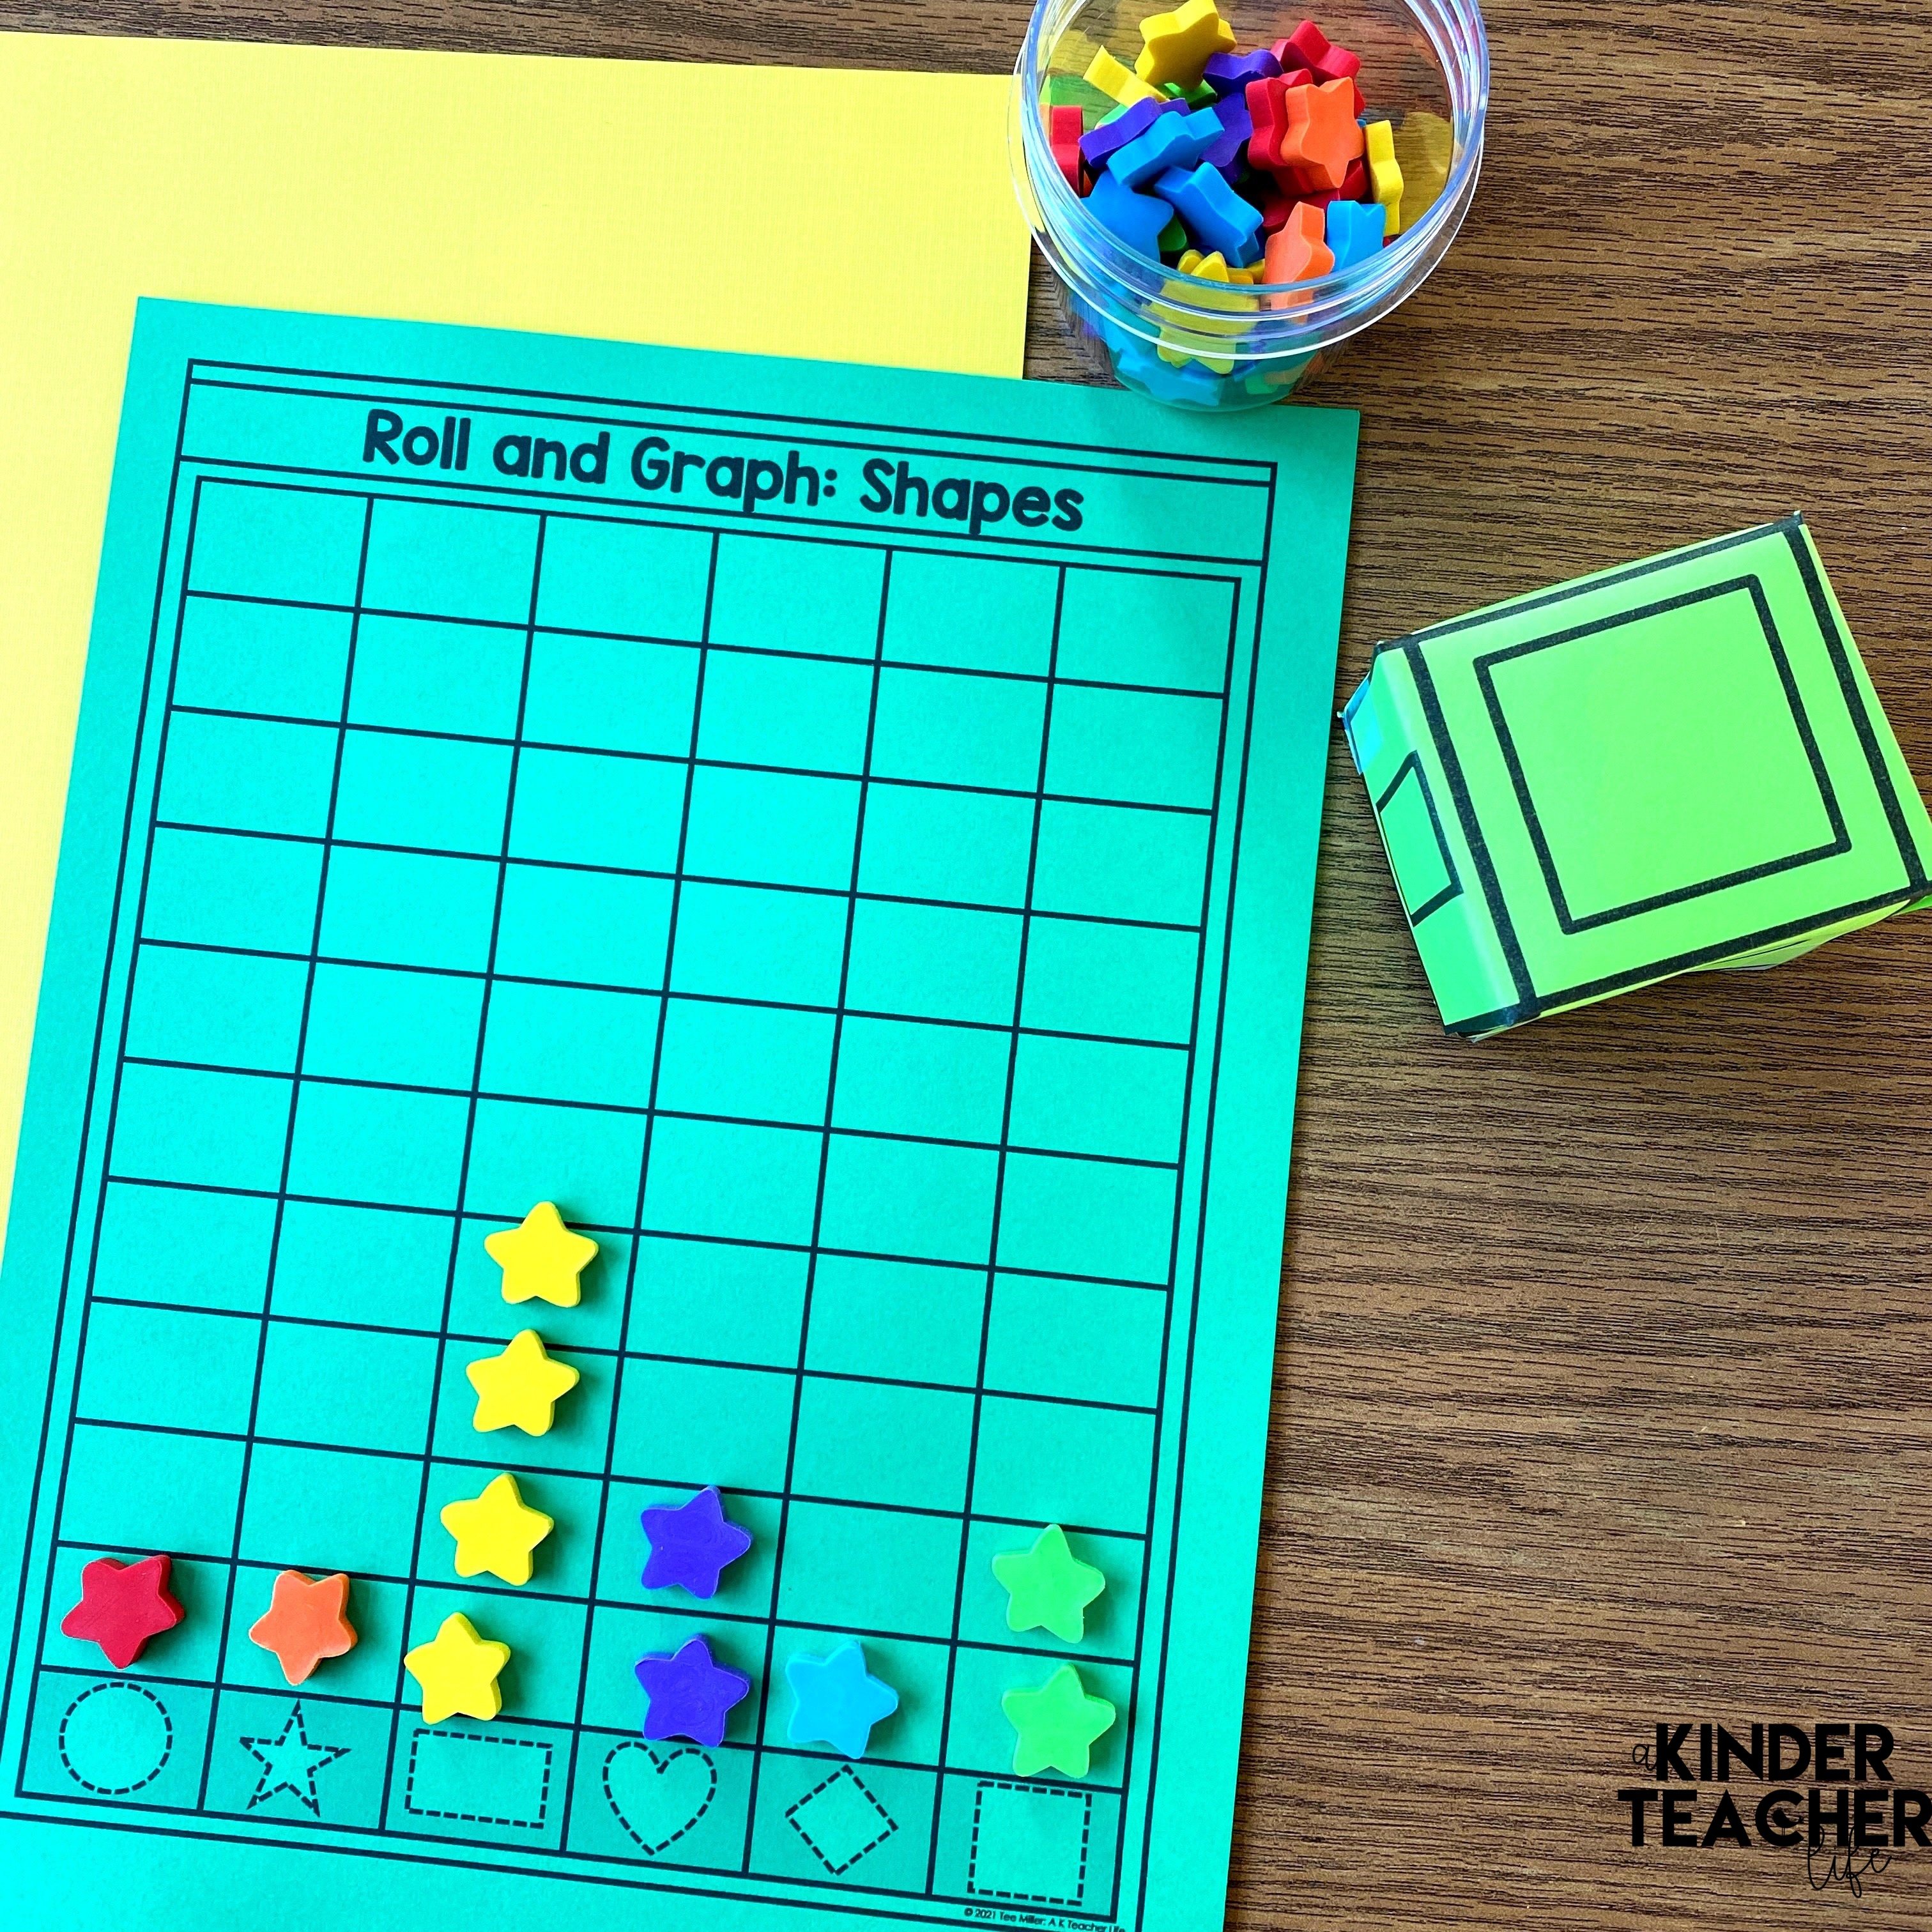
Roll and Graph Shapes
Roll and graph shapes.
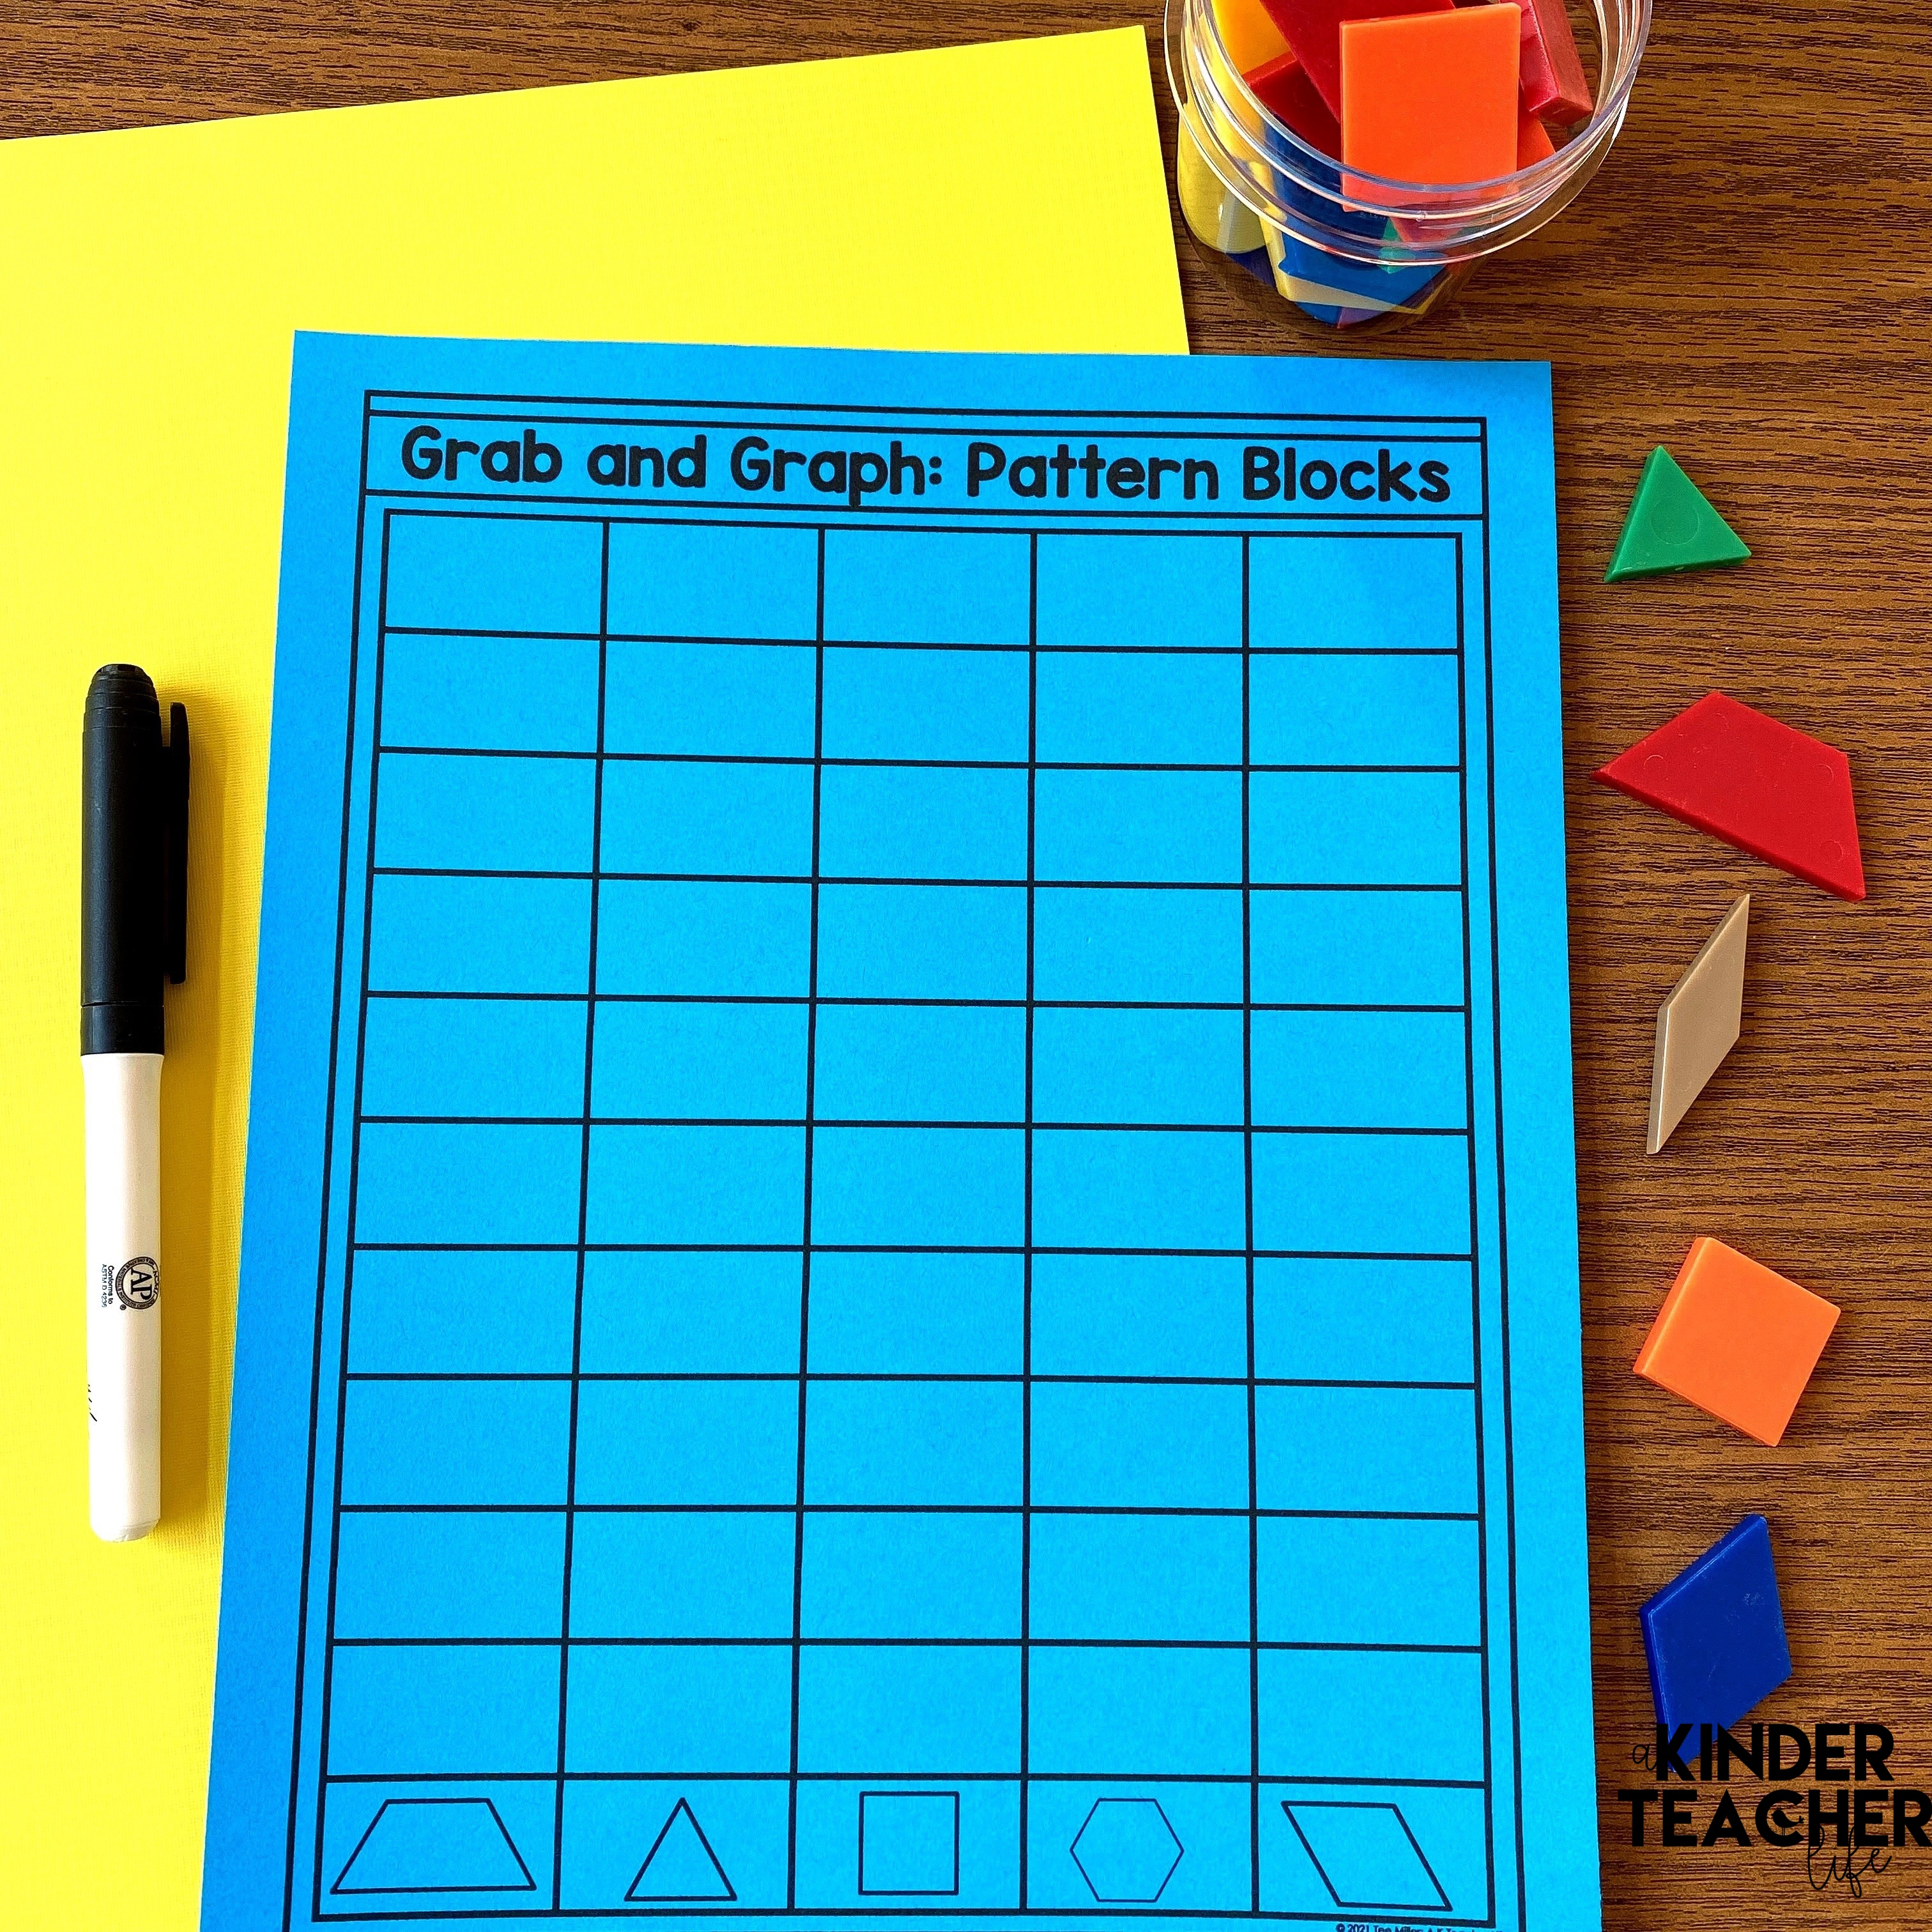
Grab and Graph: Pattern Blocks
Grab a handful of pattern blocks, count how many of each shape, and graph the data.
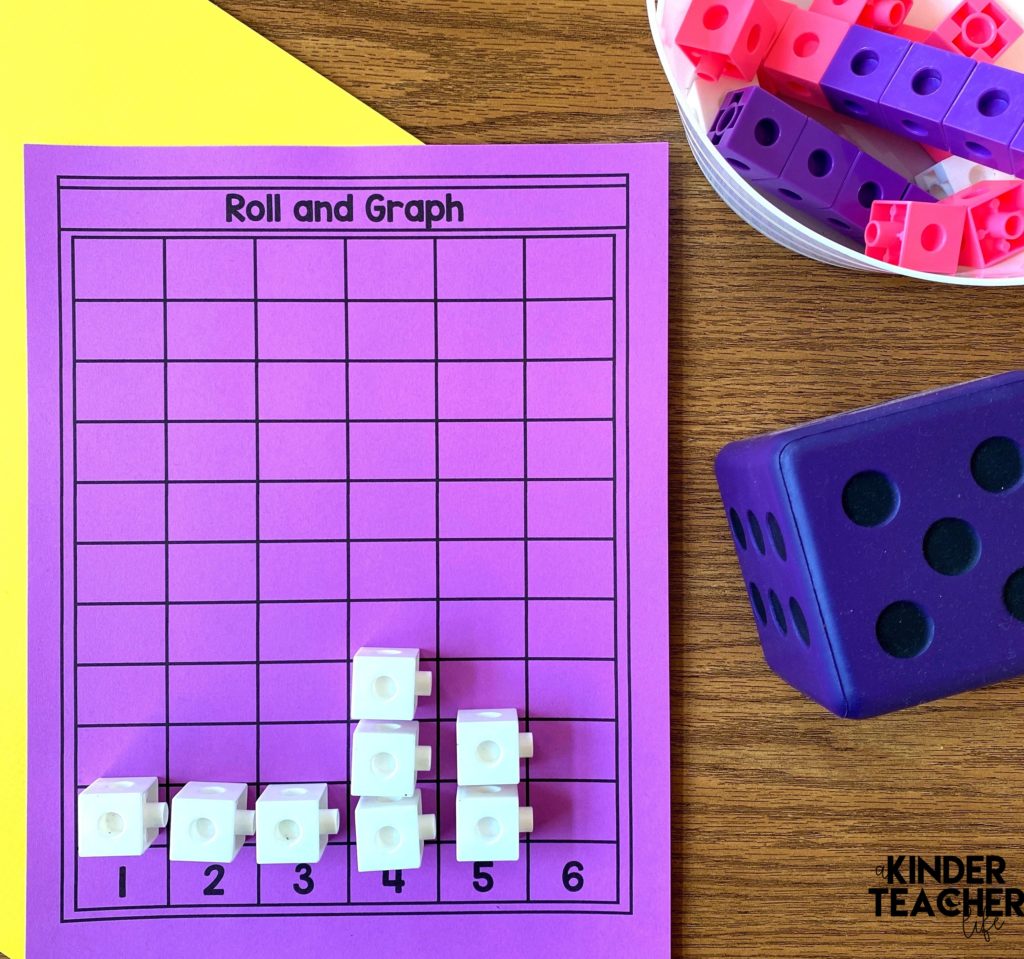
Roll and Graph
Roll a die and graph which numbers you land on.
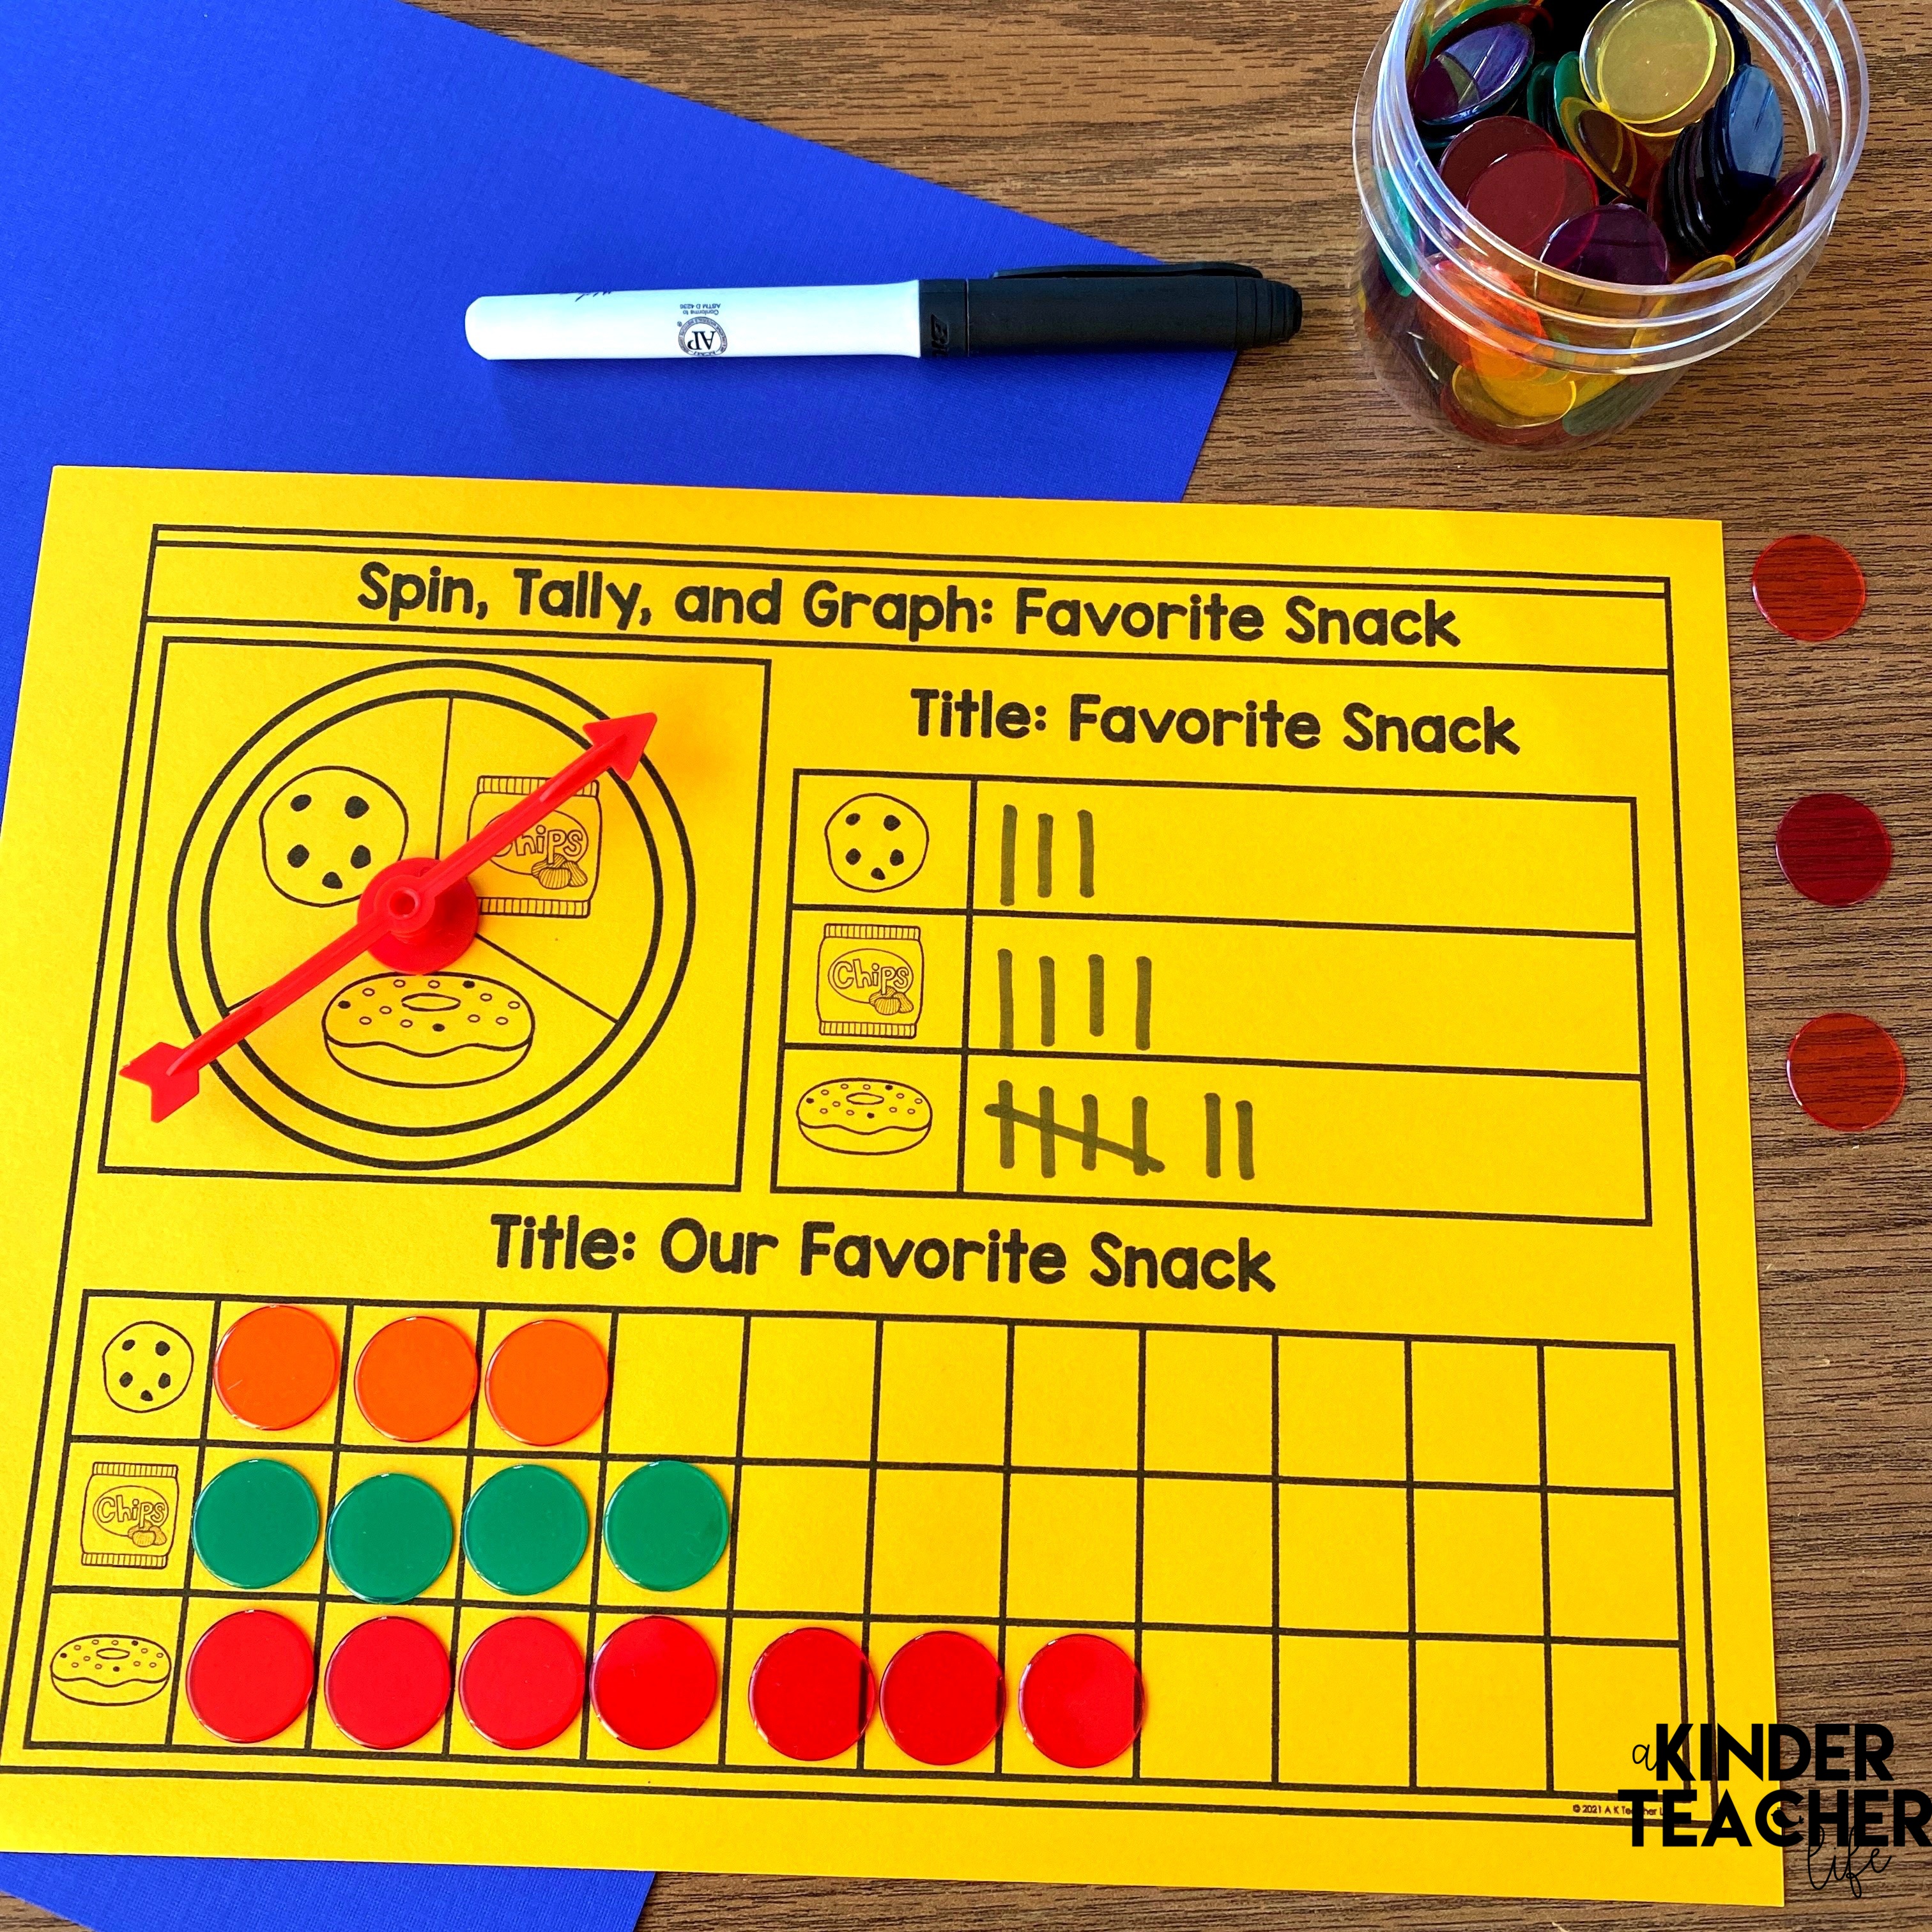
Favorite Snack: Spin, Tally, and Graph
Spin, tally, and graph information about favorite snacks.
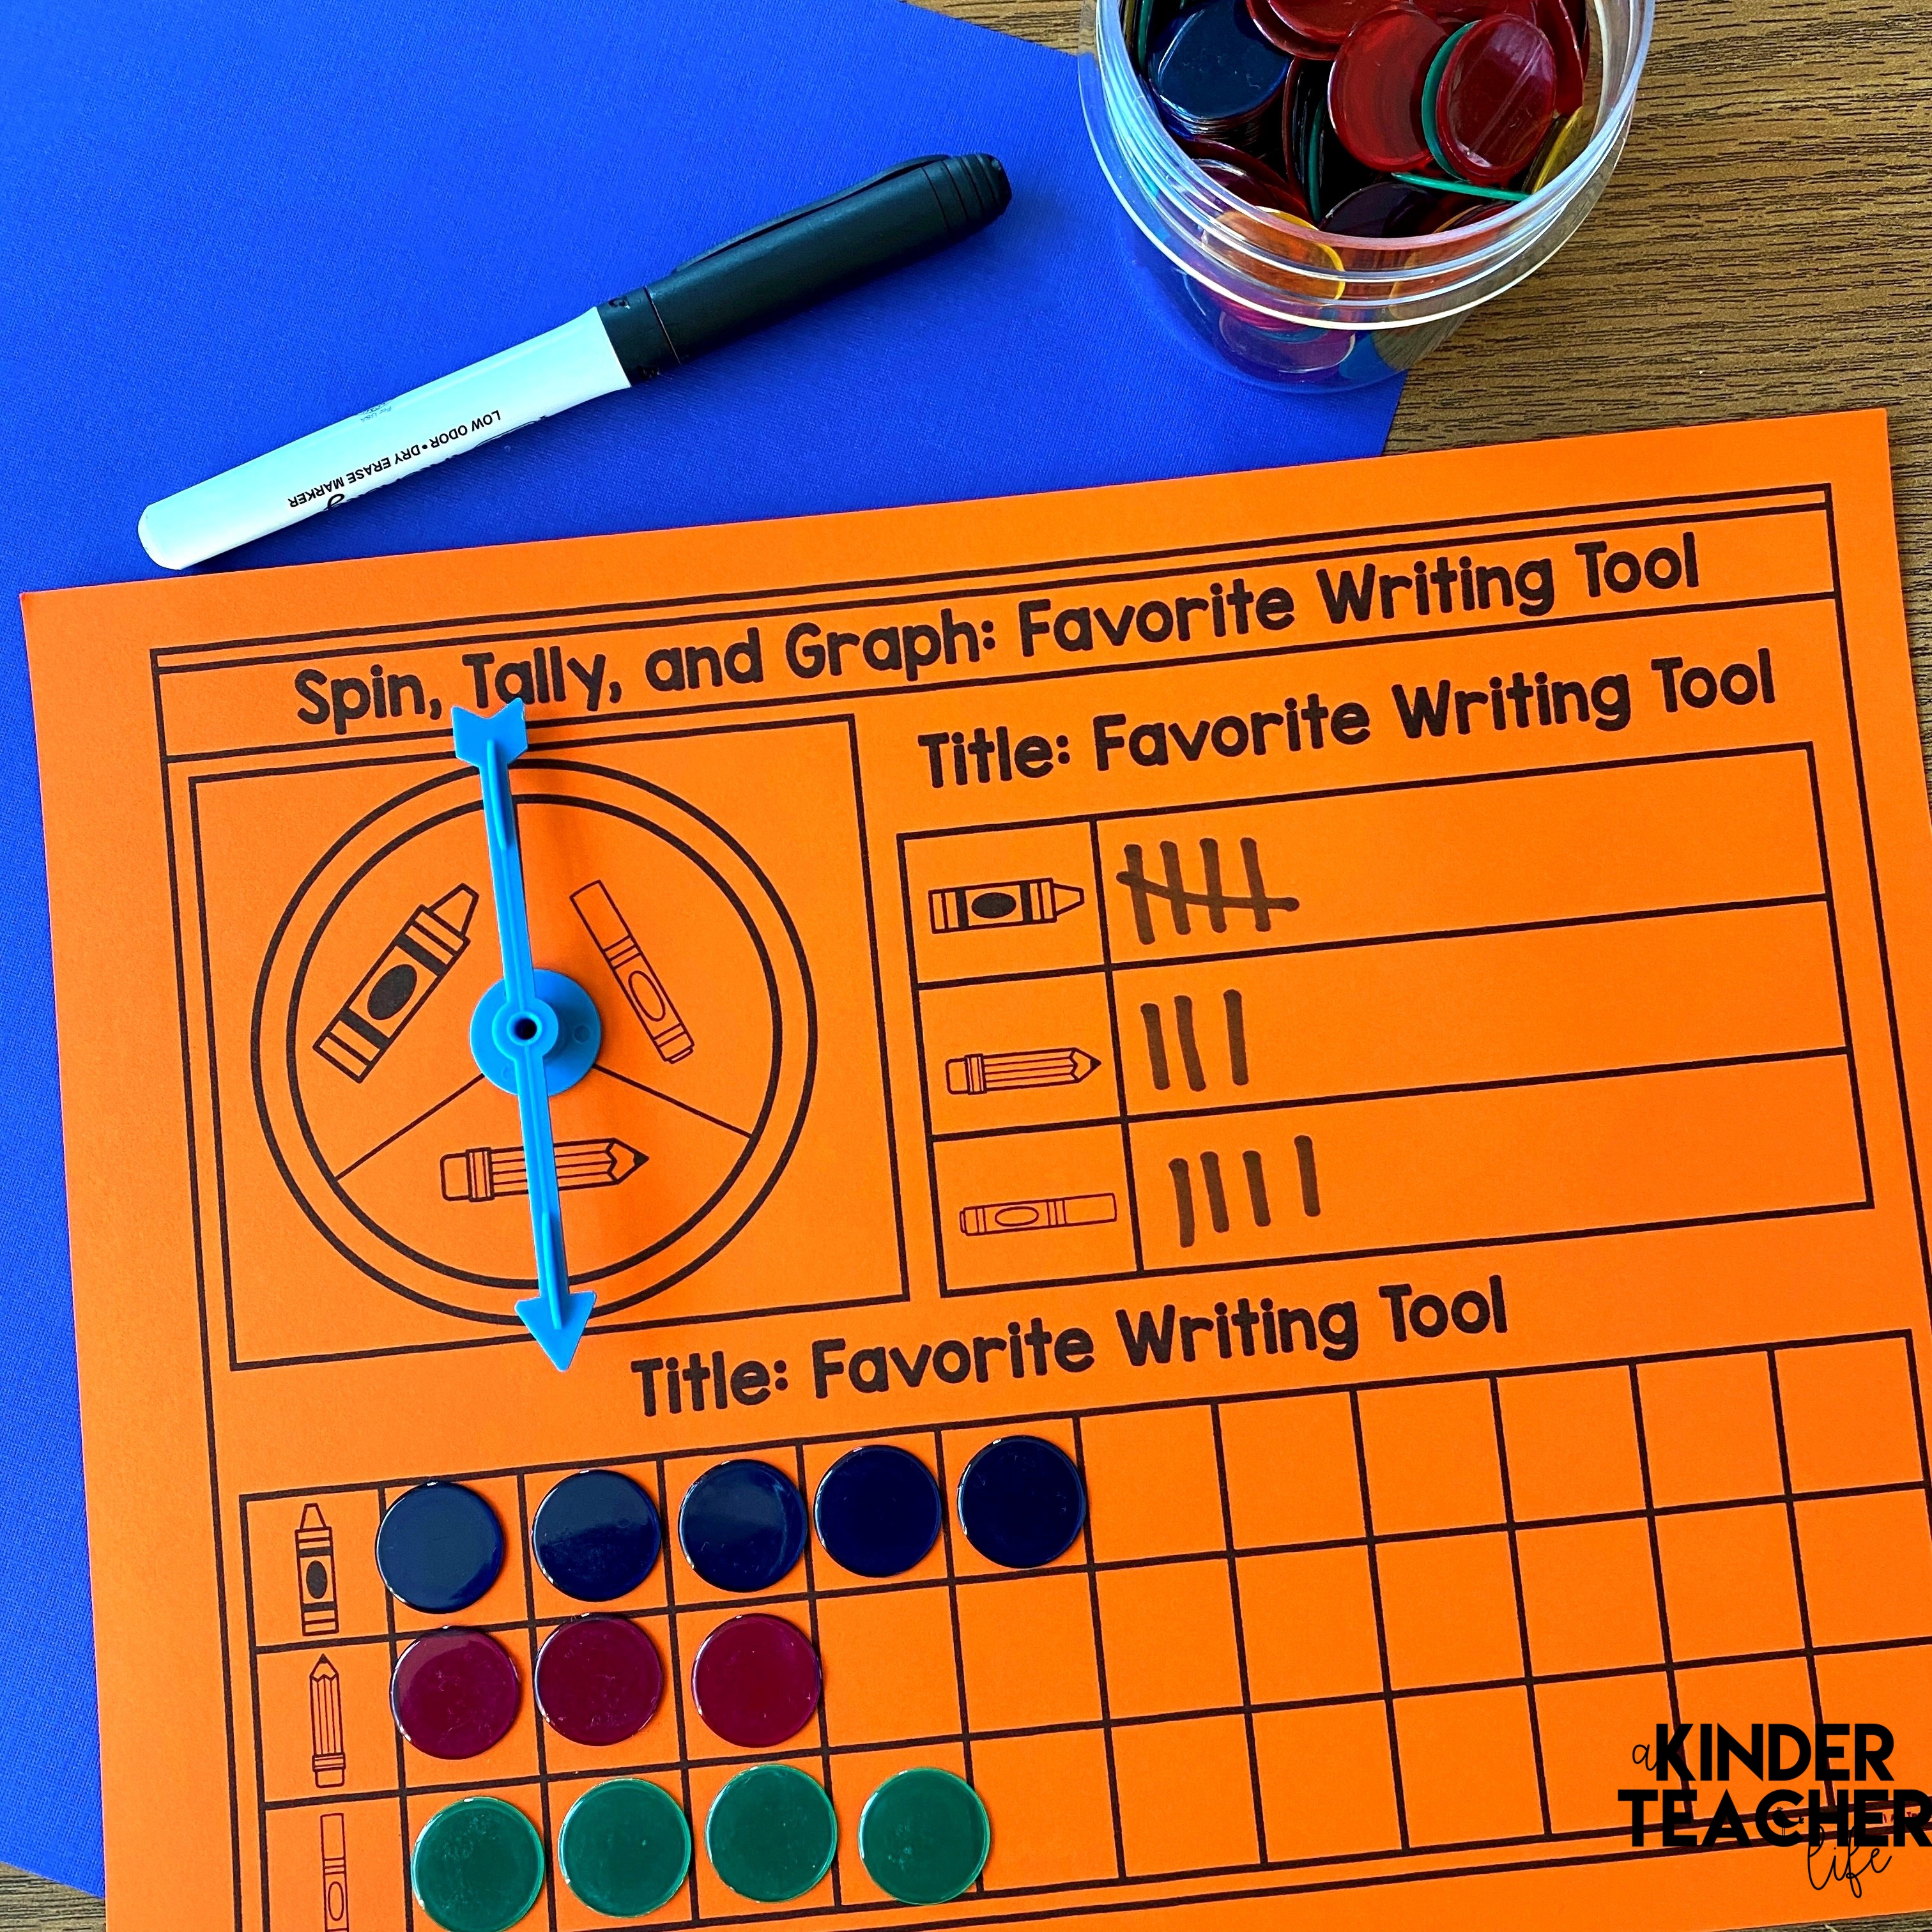
Favorite Writing Tool: Spin, Tally, and Graph
Spin, tally, and graph information about favorite writing tools.
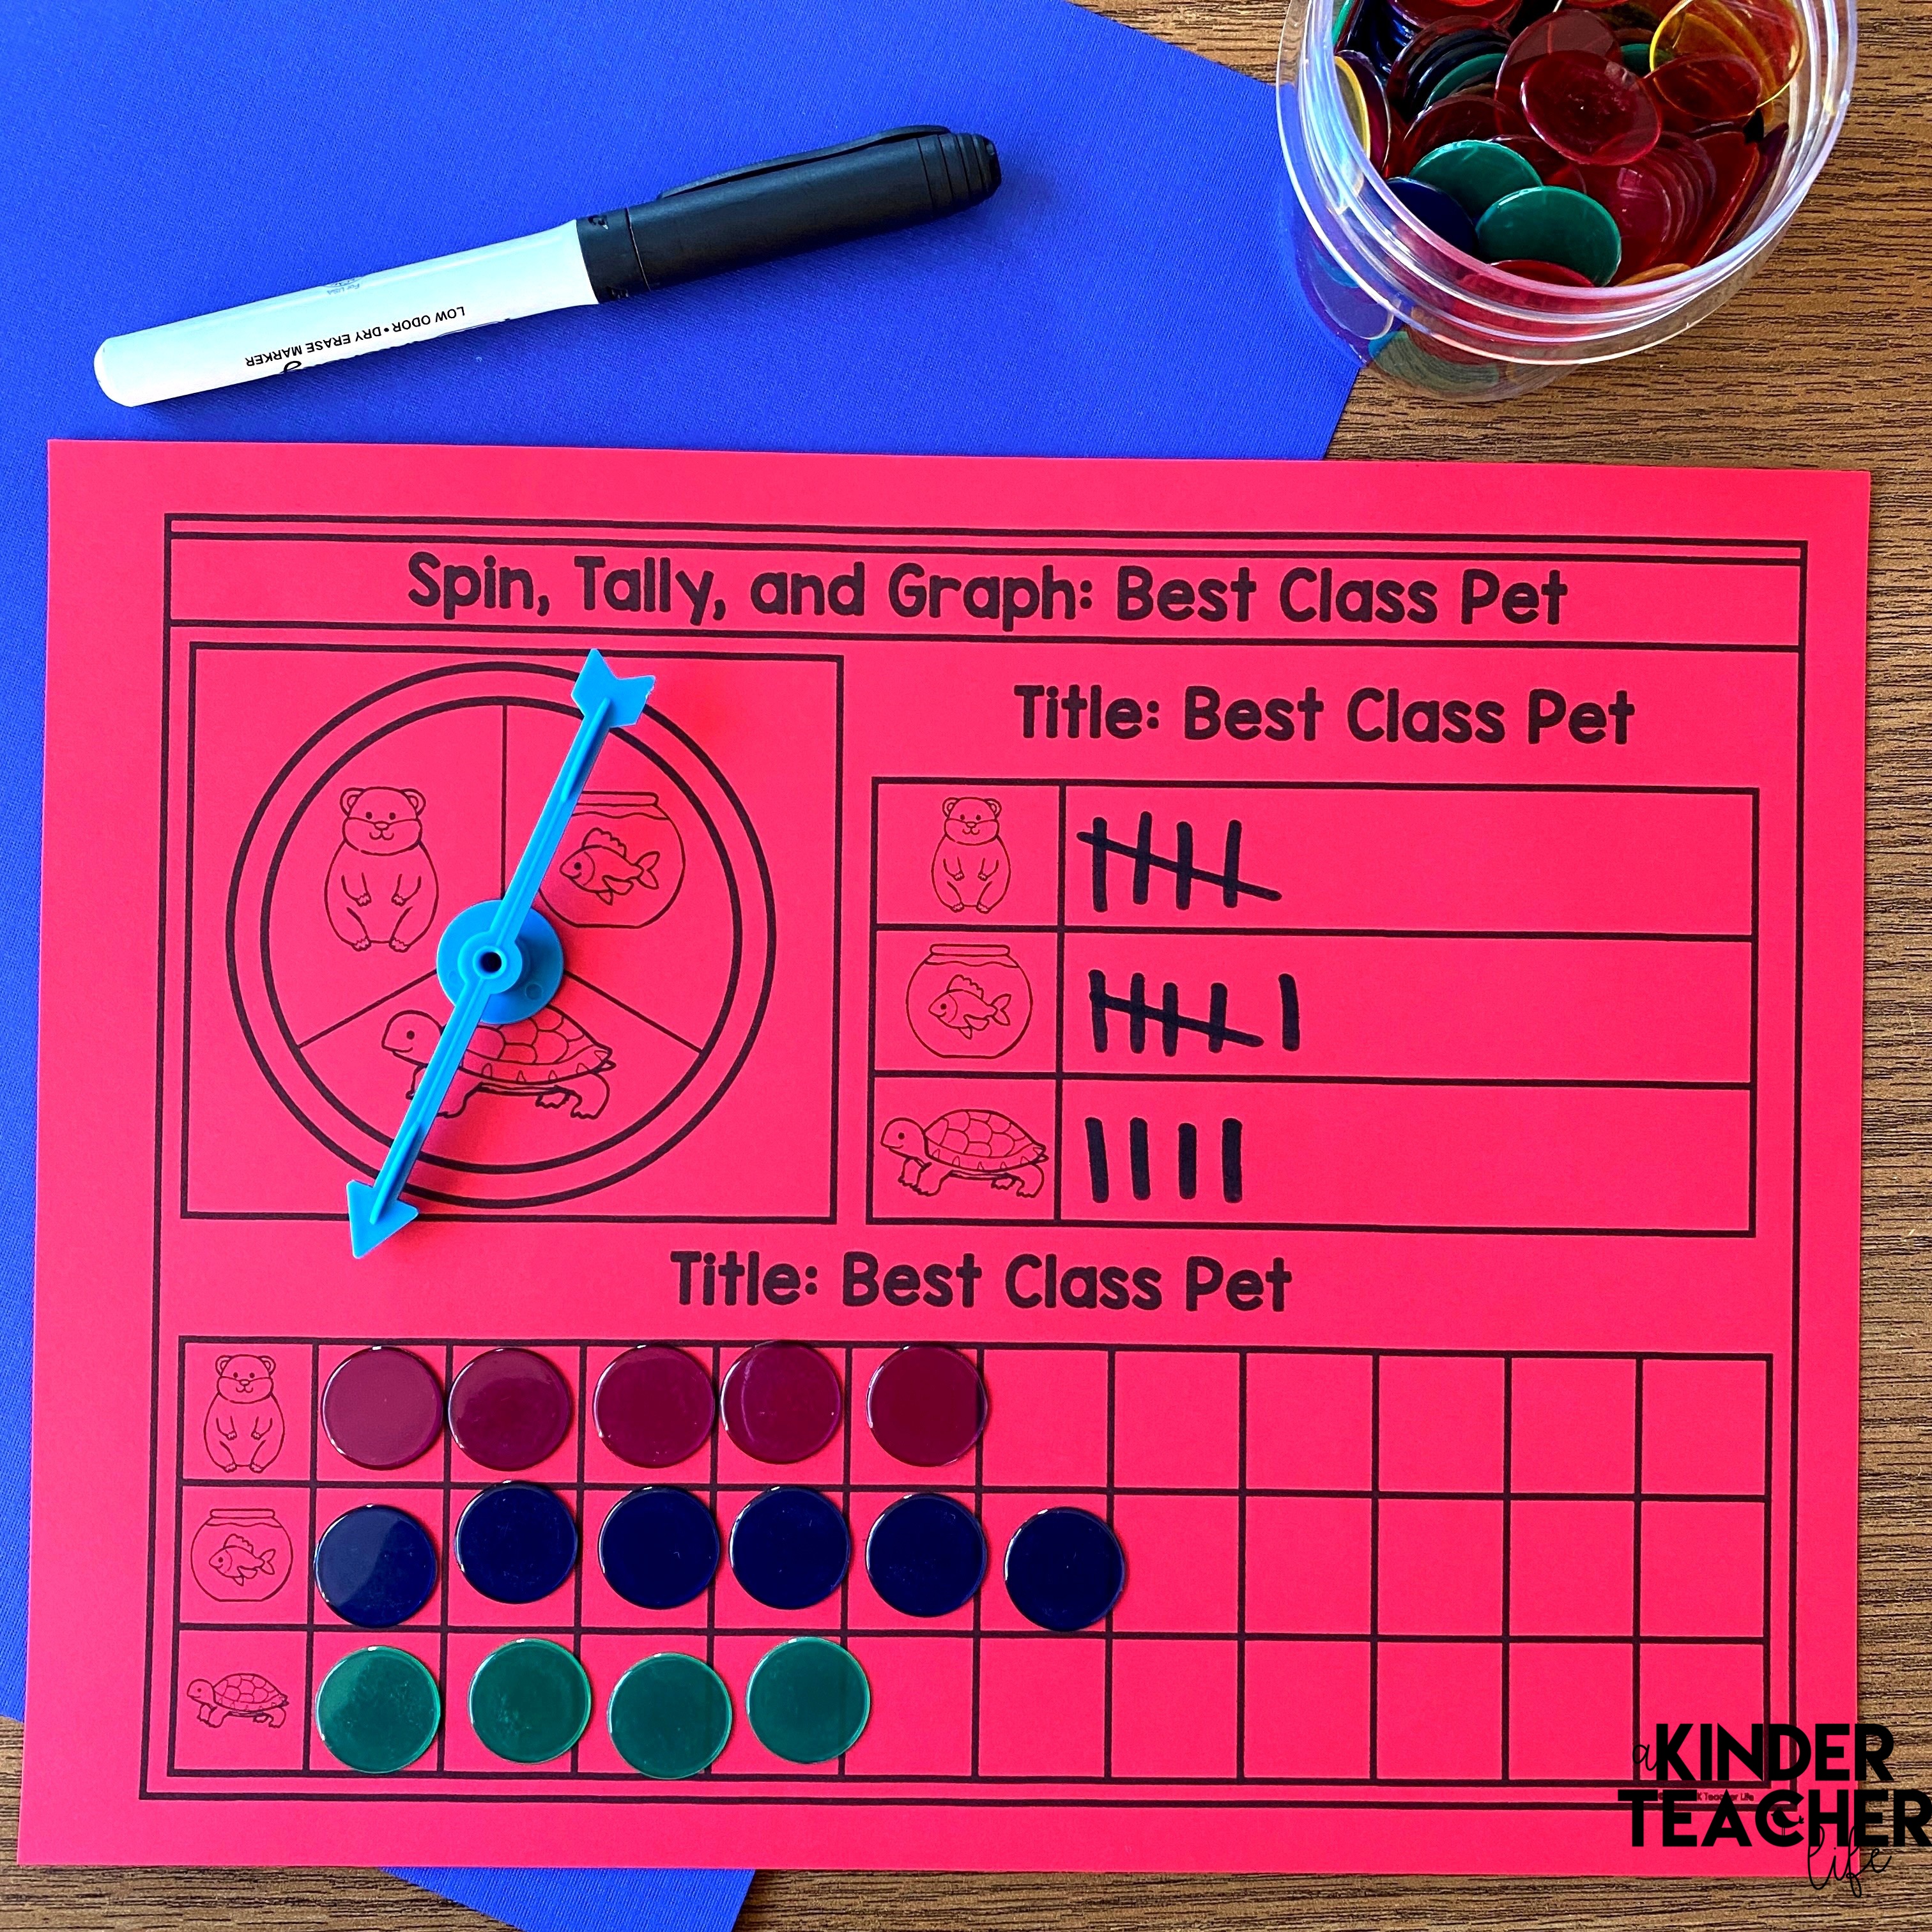
The Best Class Pet: Spin, Tally, and Graph
Spin, tally, and graph information about the best class pet.
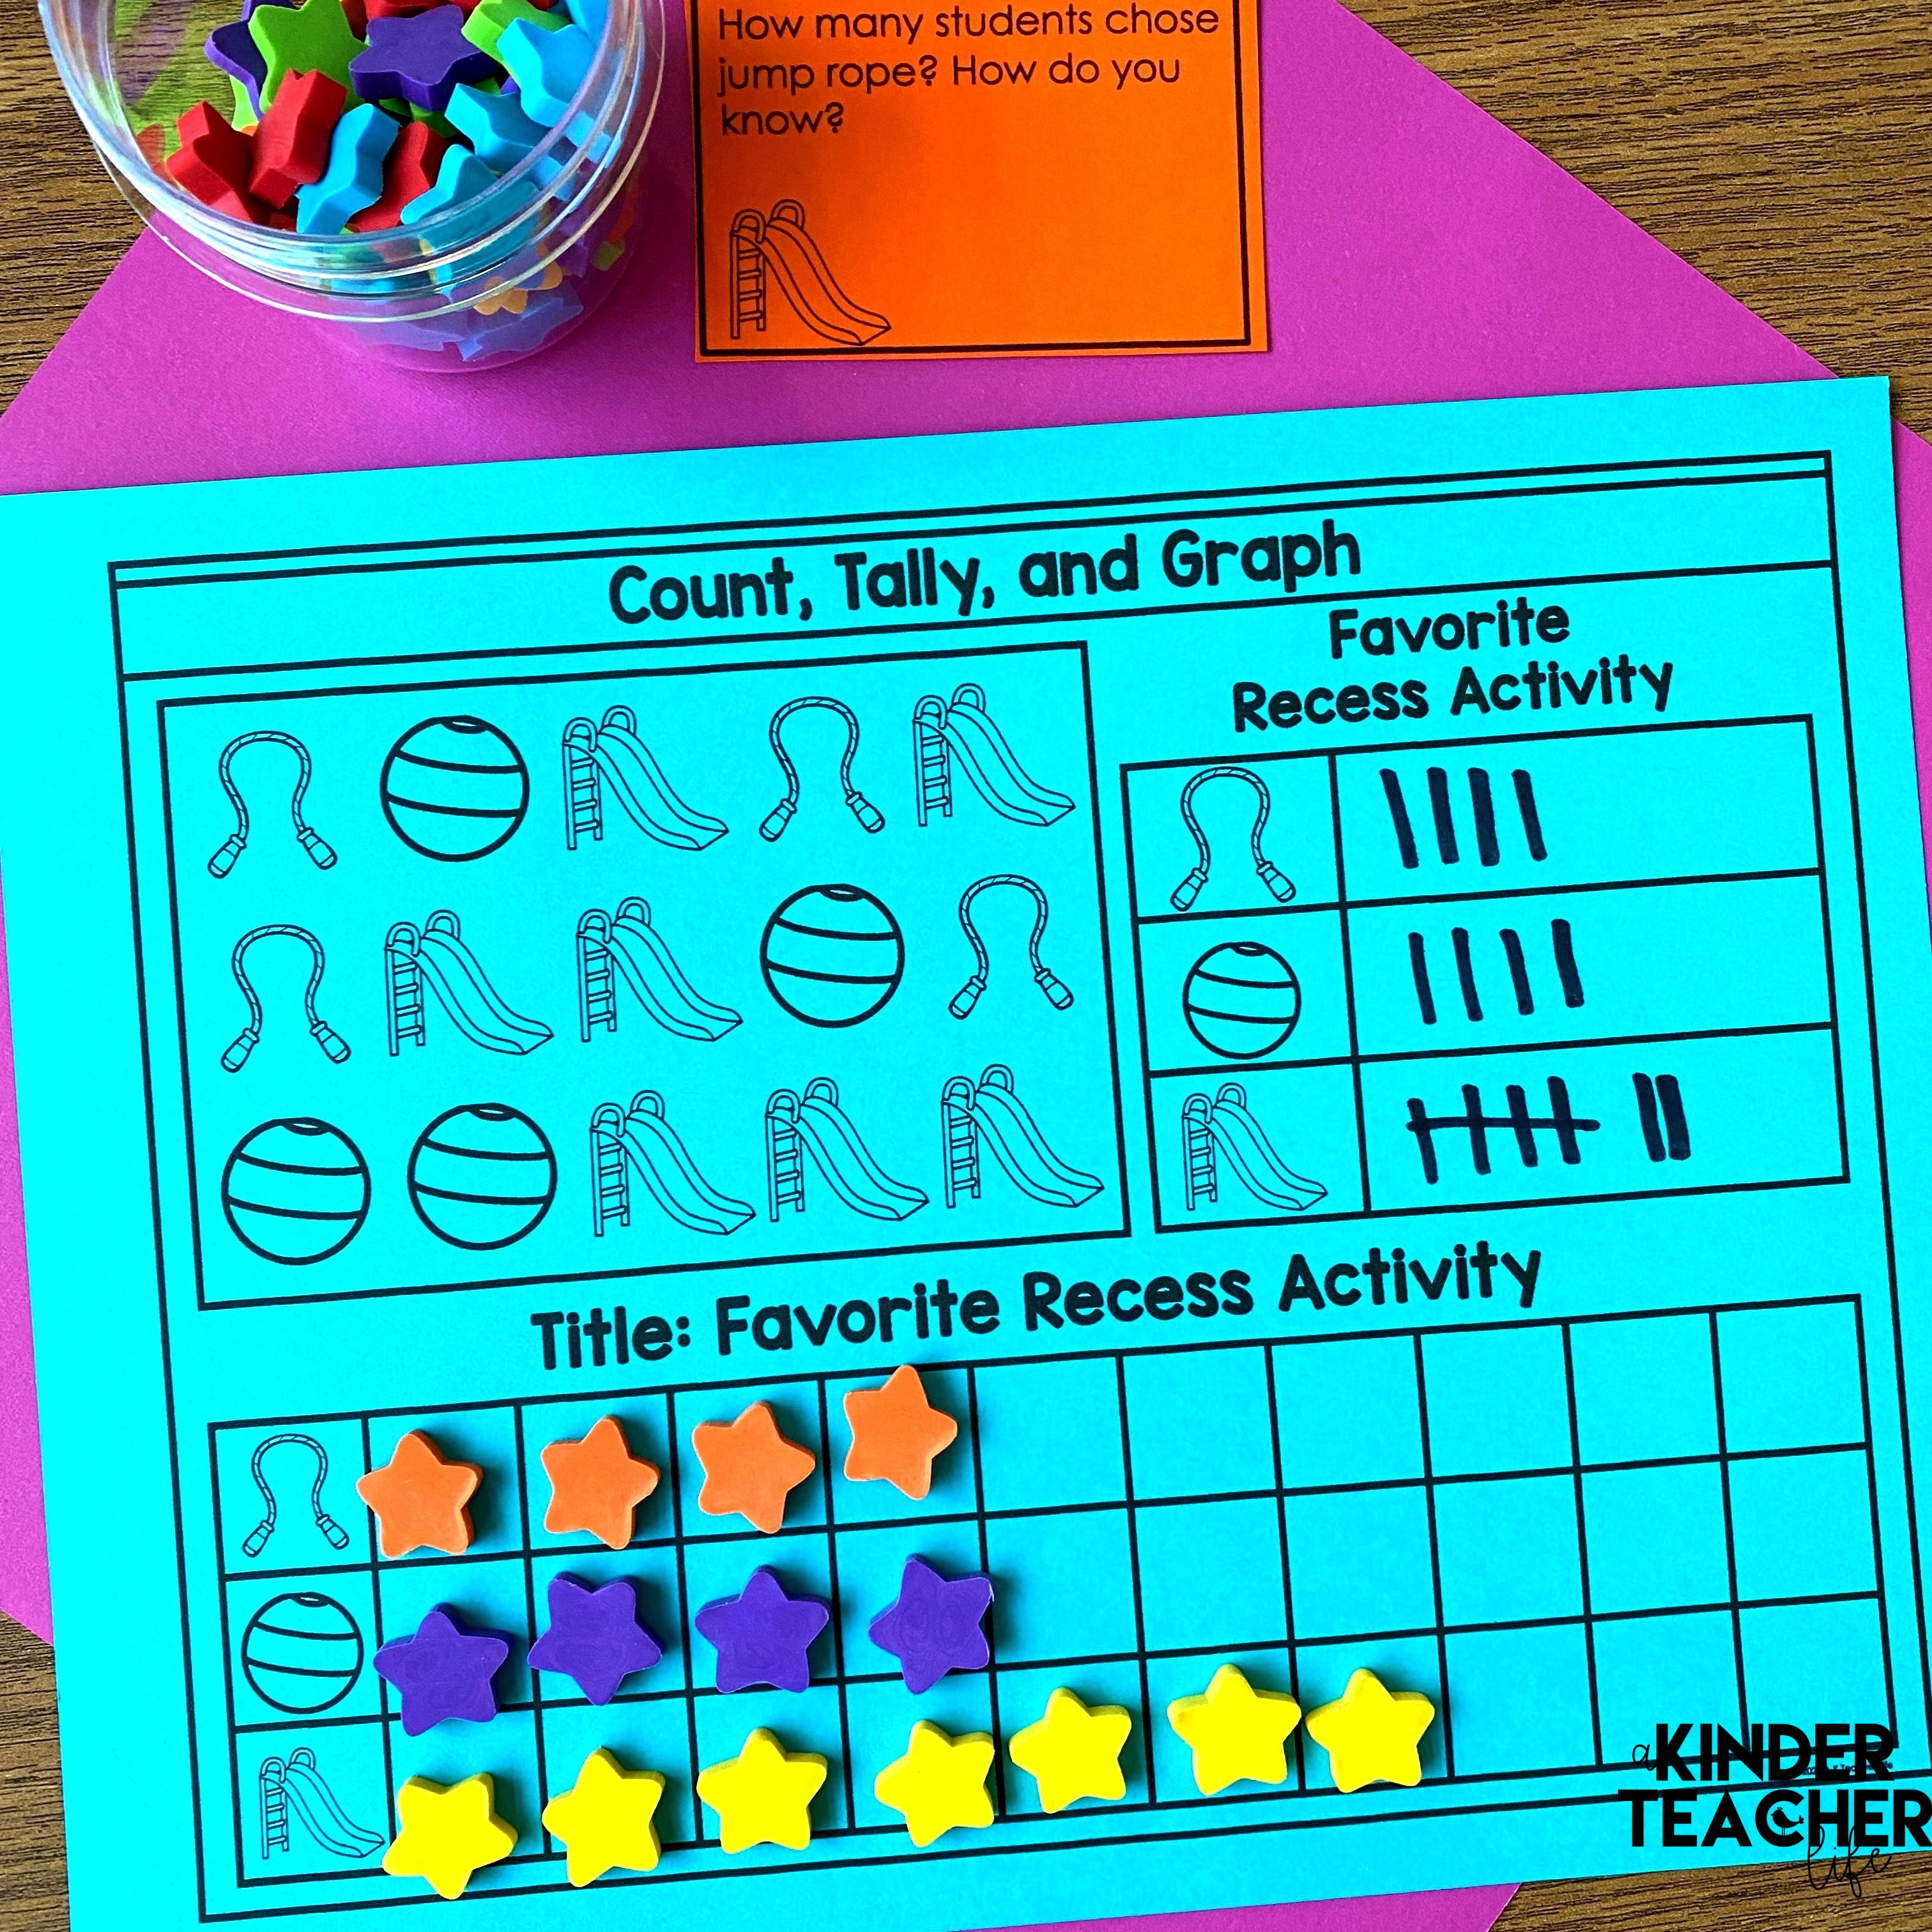
Tally, Graph, and Analyze: Favorite Recess Activity
Count, tally, and graph the information provided.
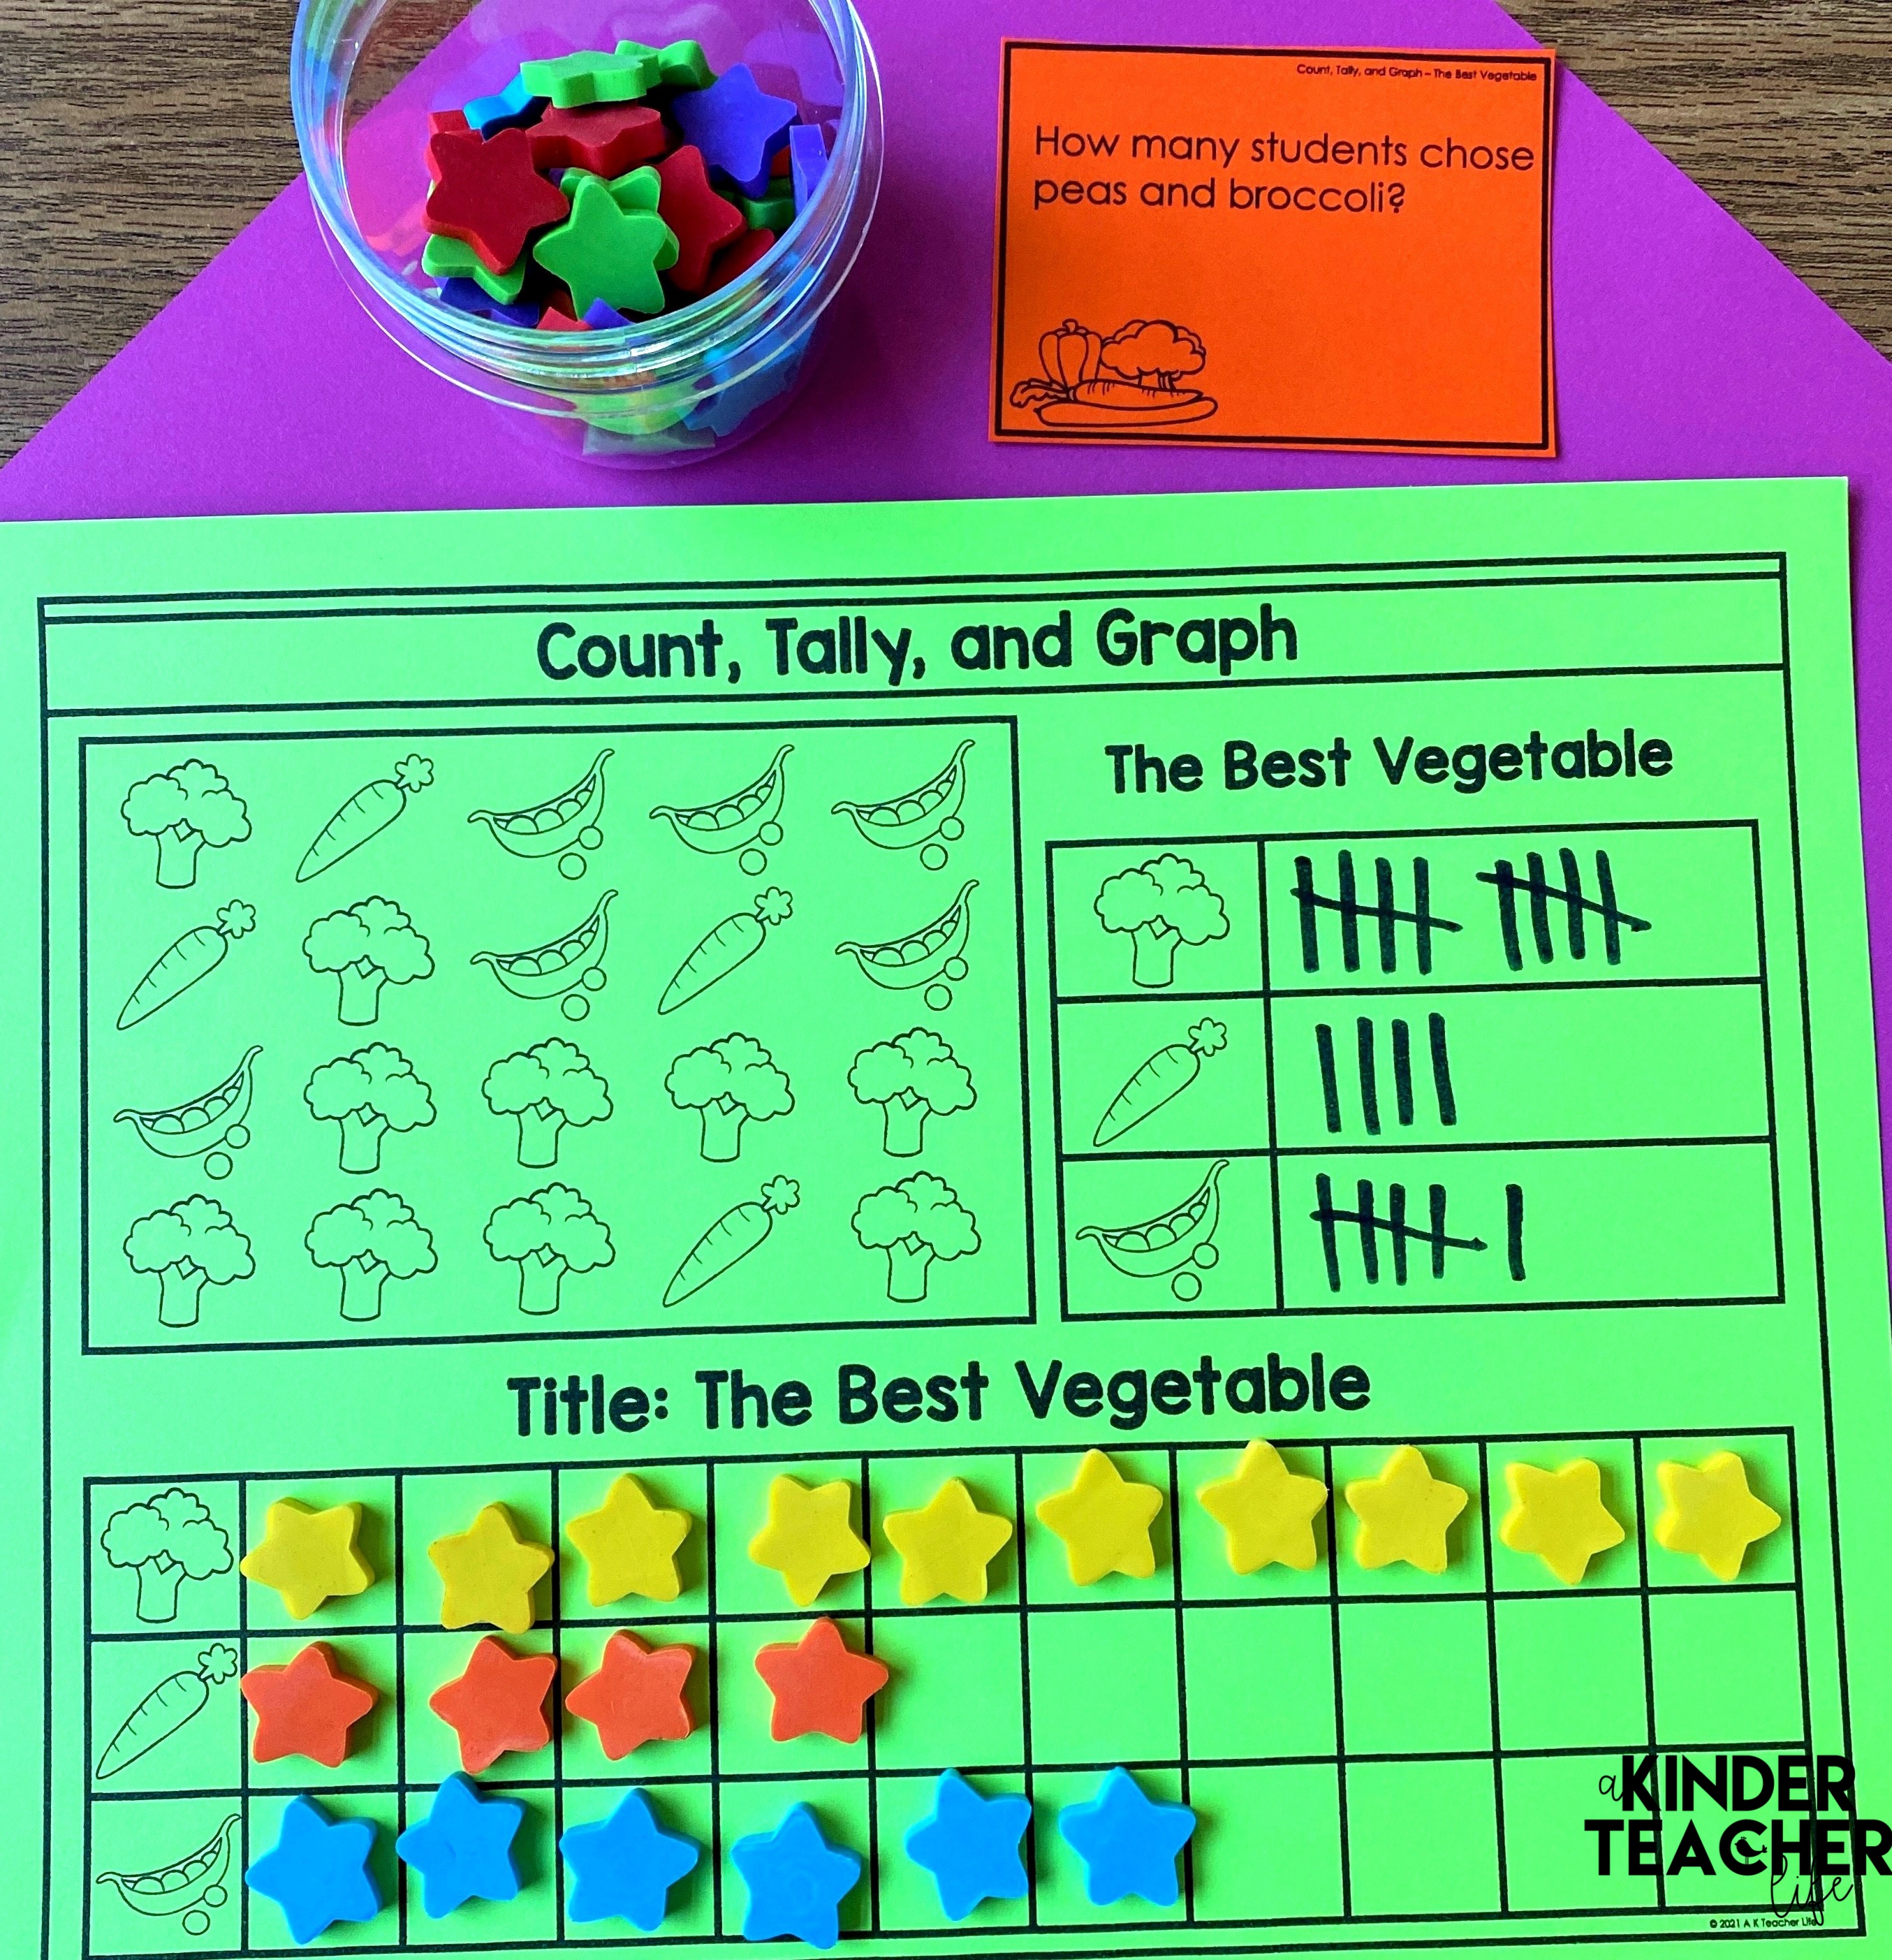
Tally, Graph, and Analyze: Best Vegetable
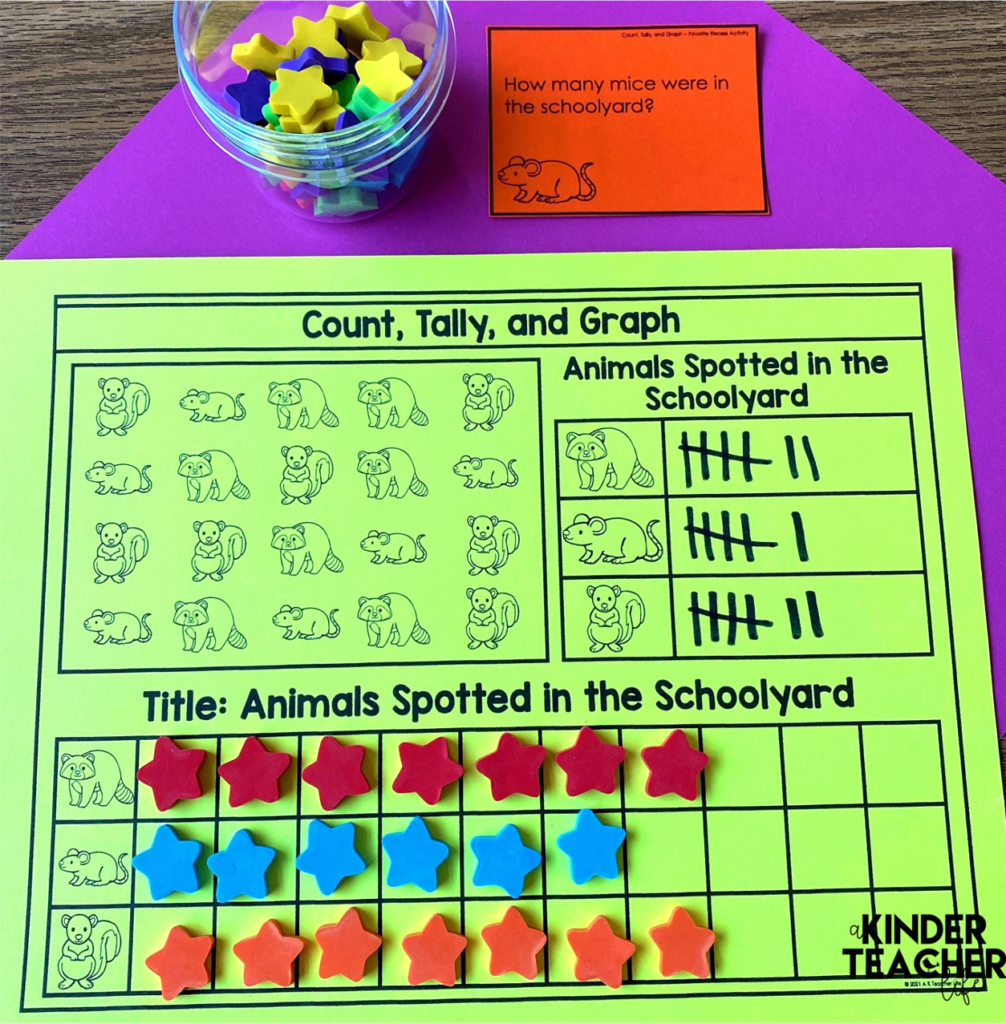
Tally, Graph, and Analyze: Animals Spotted in the Schoolyard
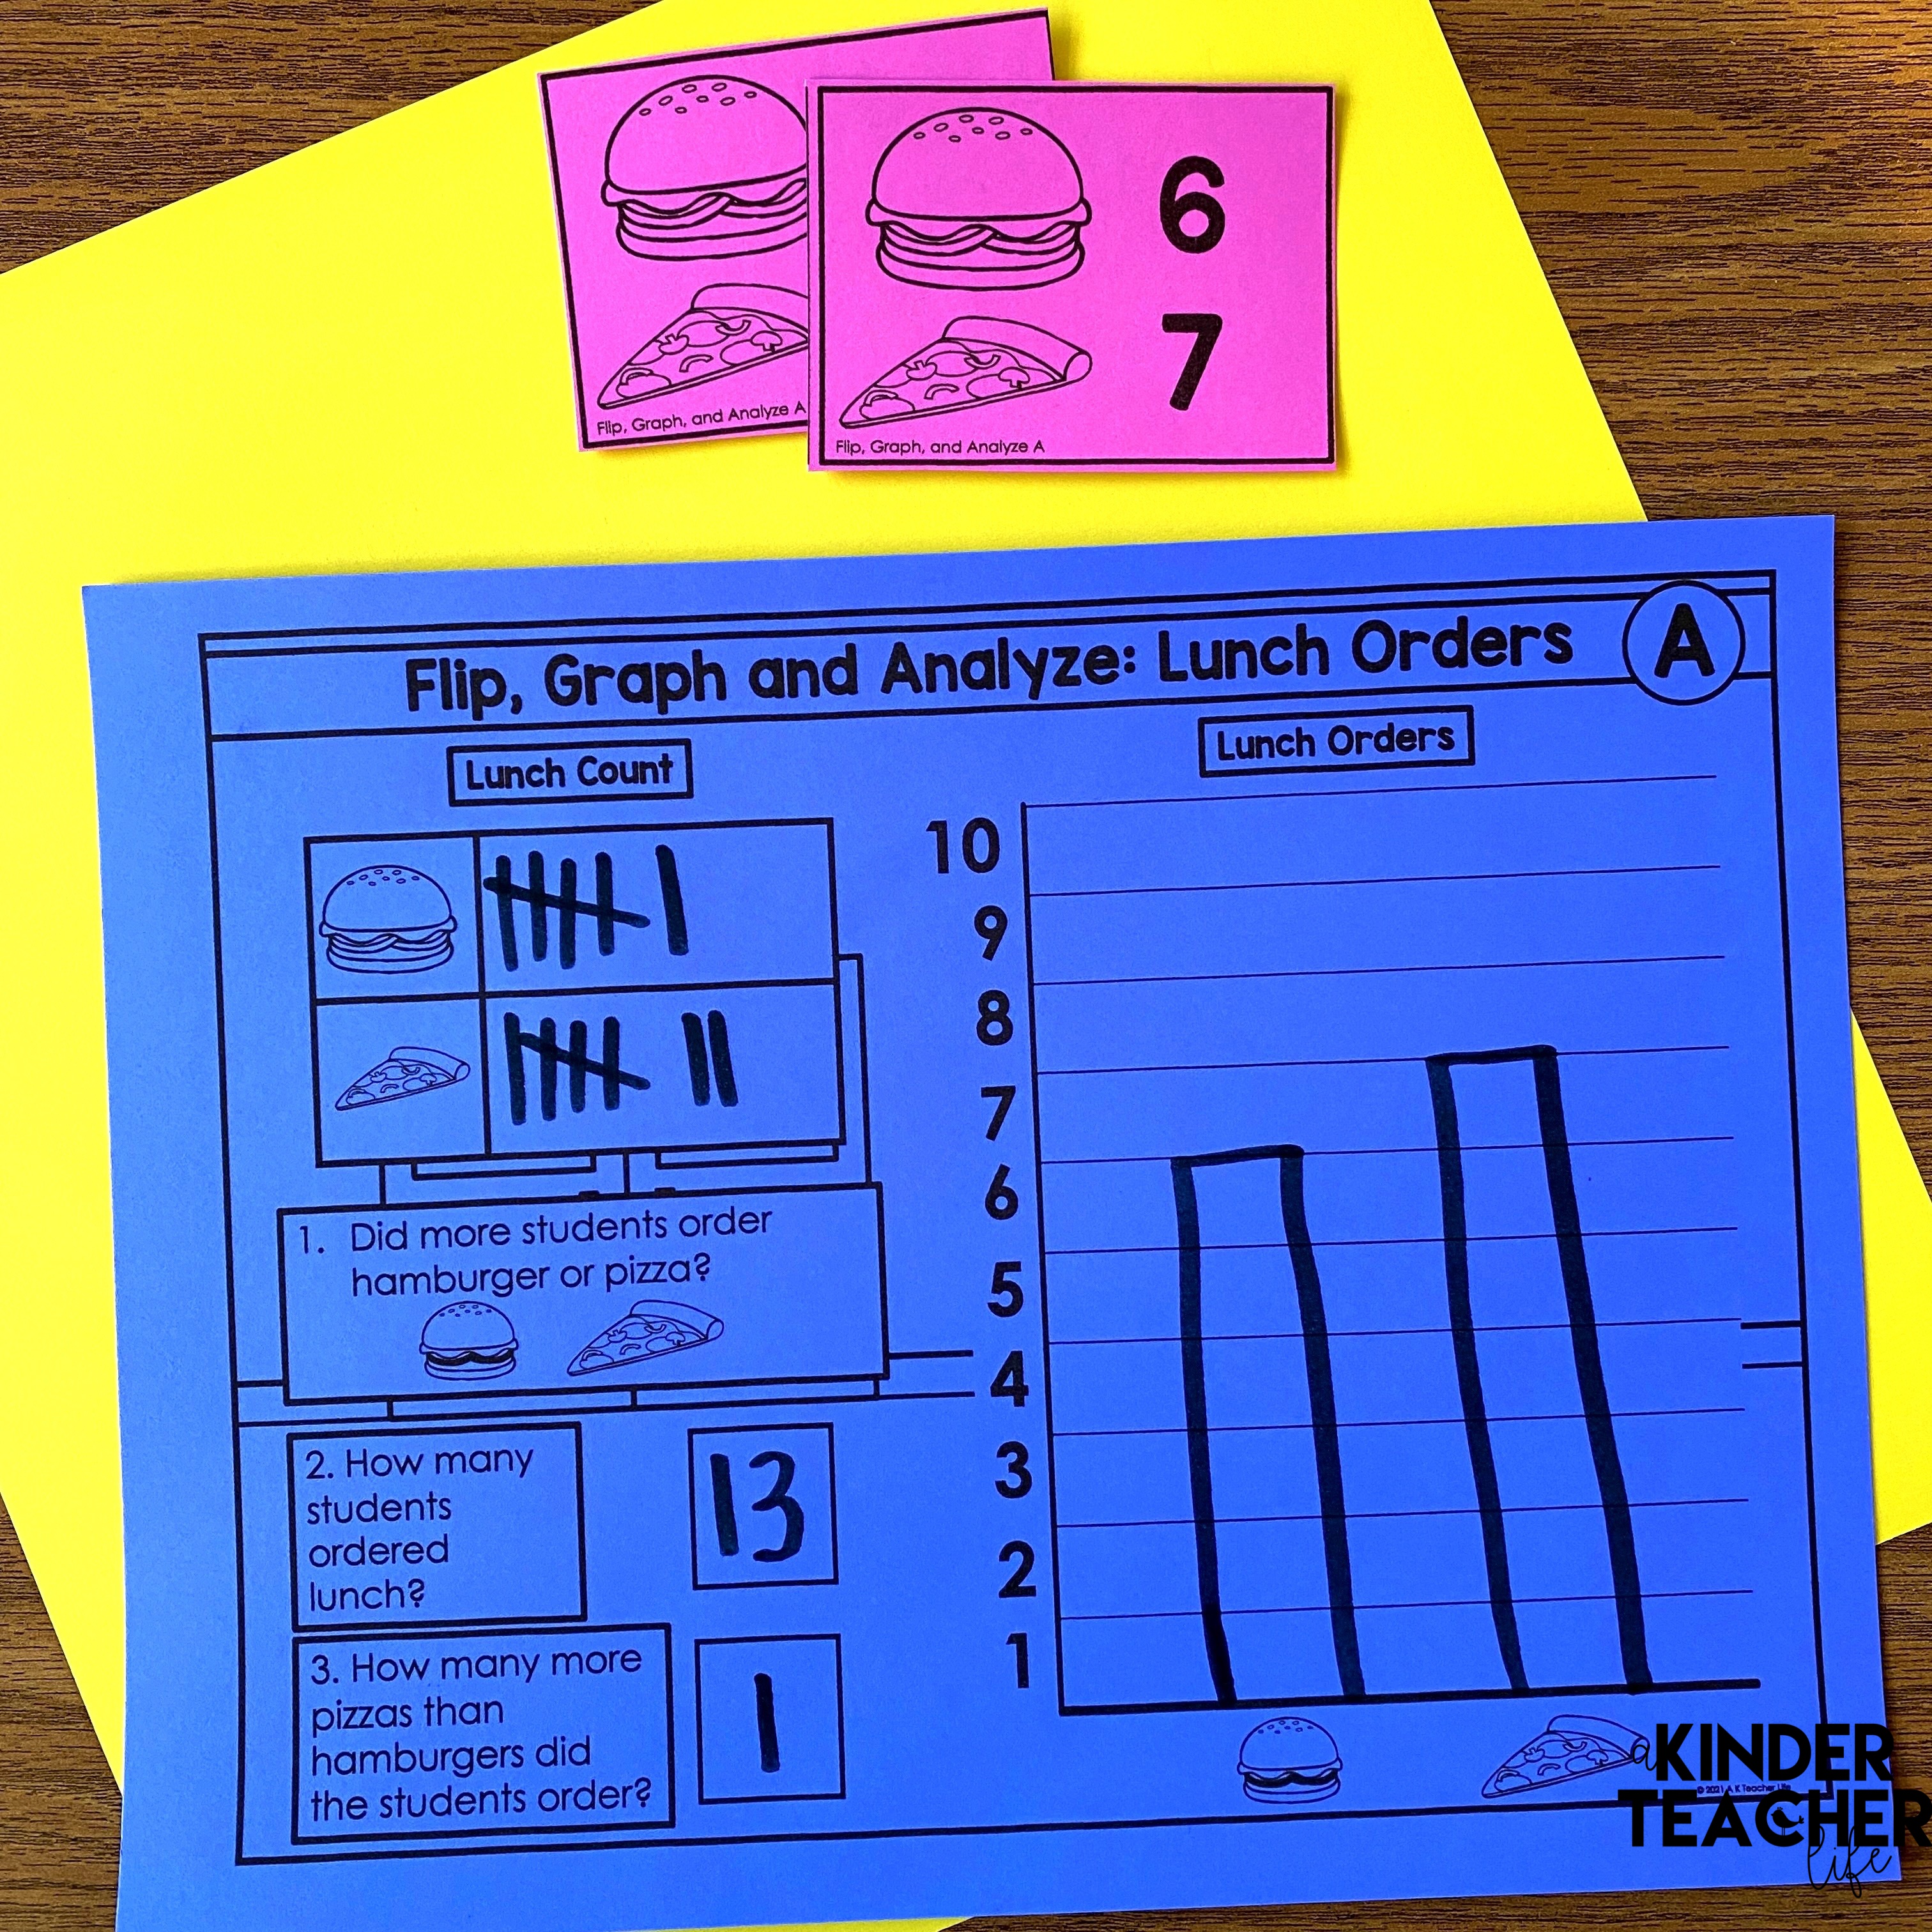
Flip, Graph, and Analyze: Lunch Orders
Create a bar graph using the information provided and analyze the data.
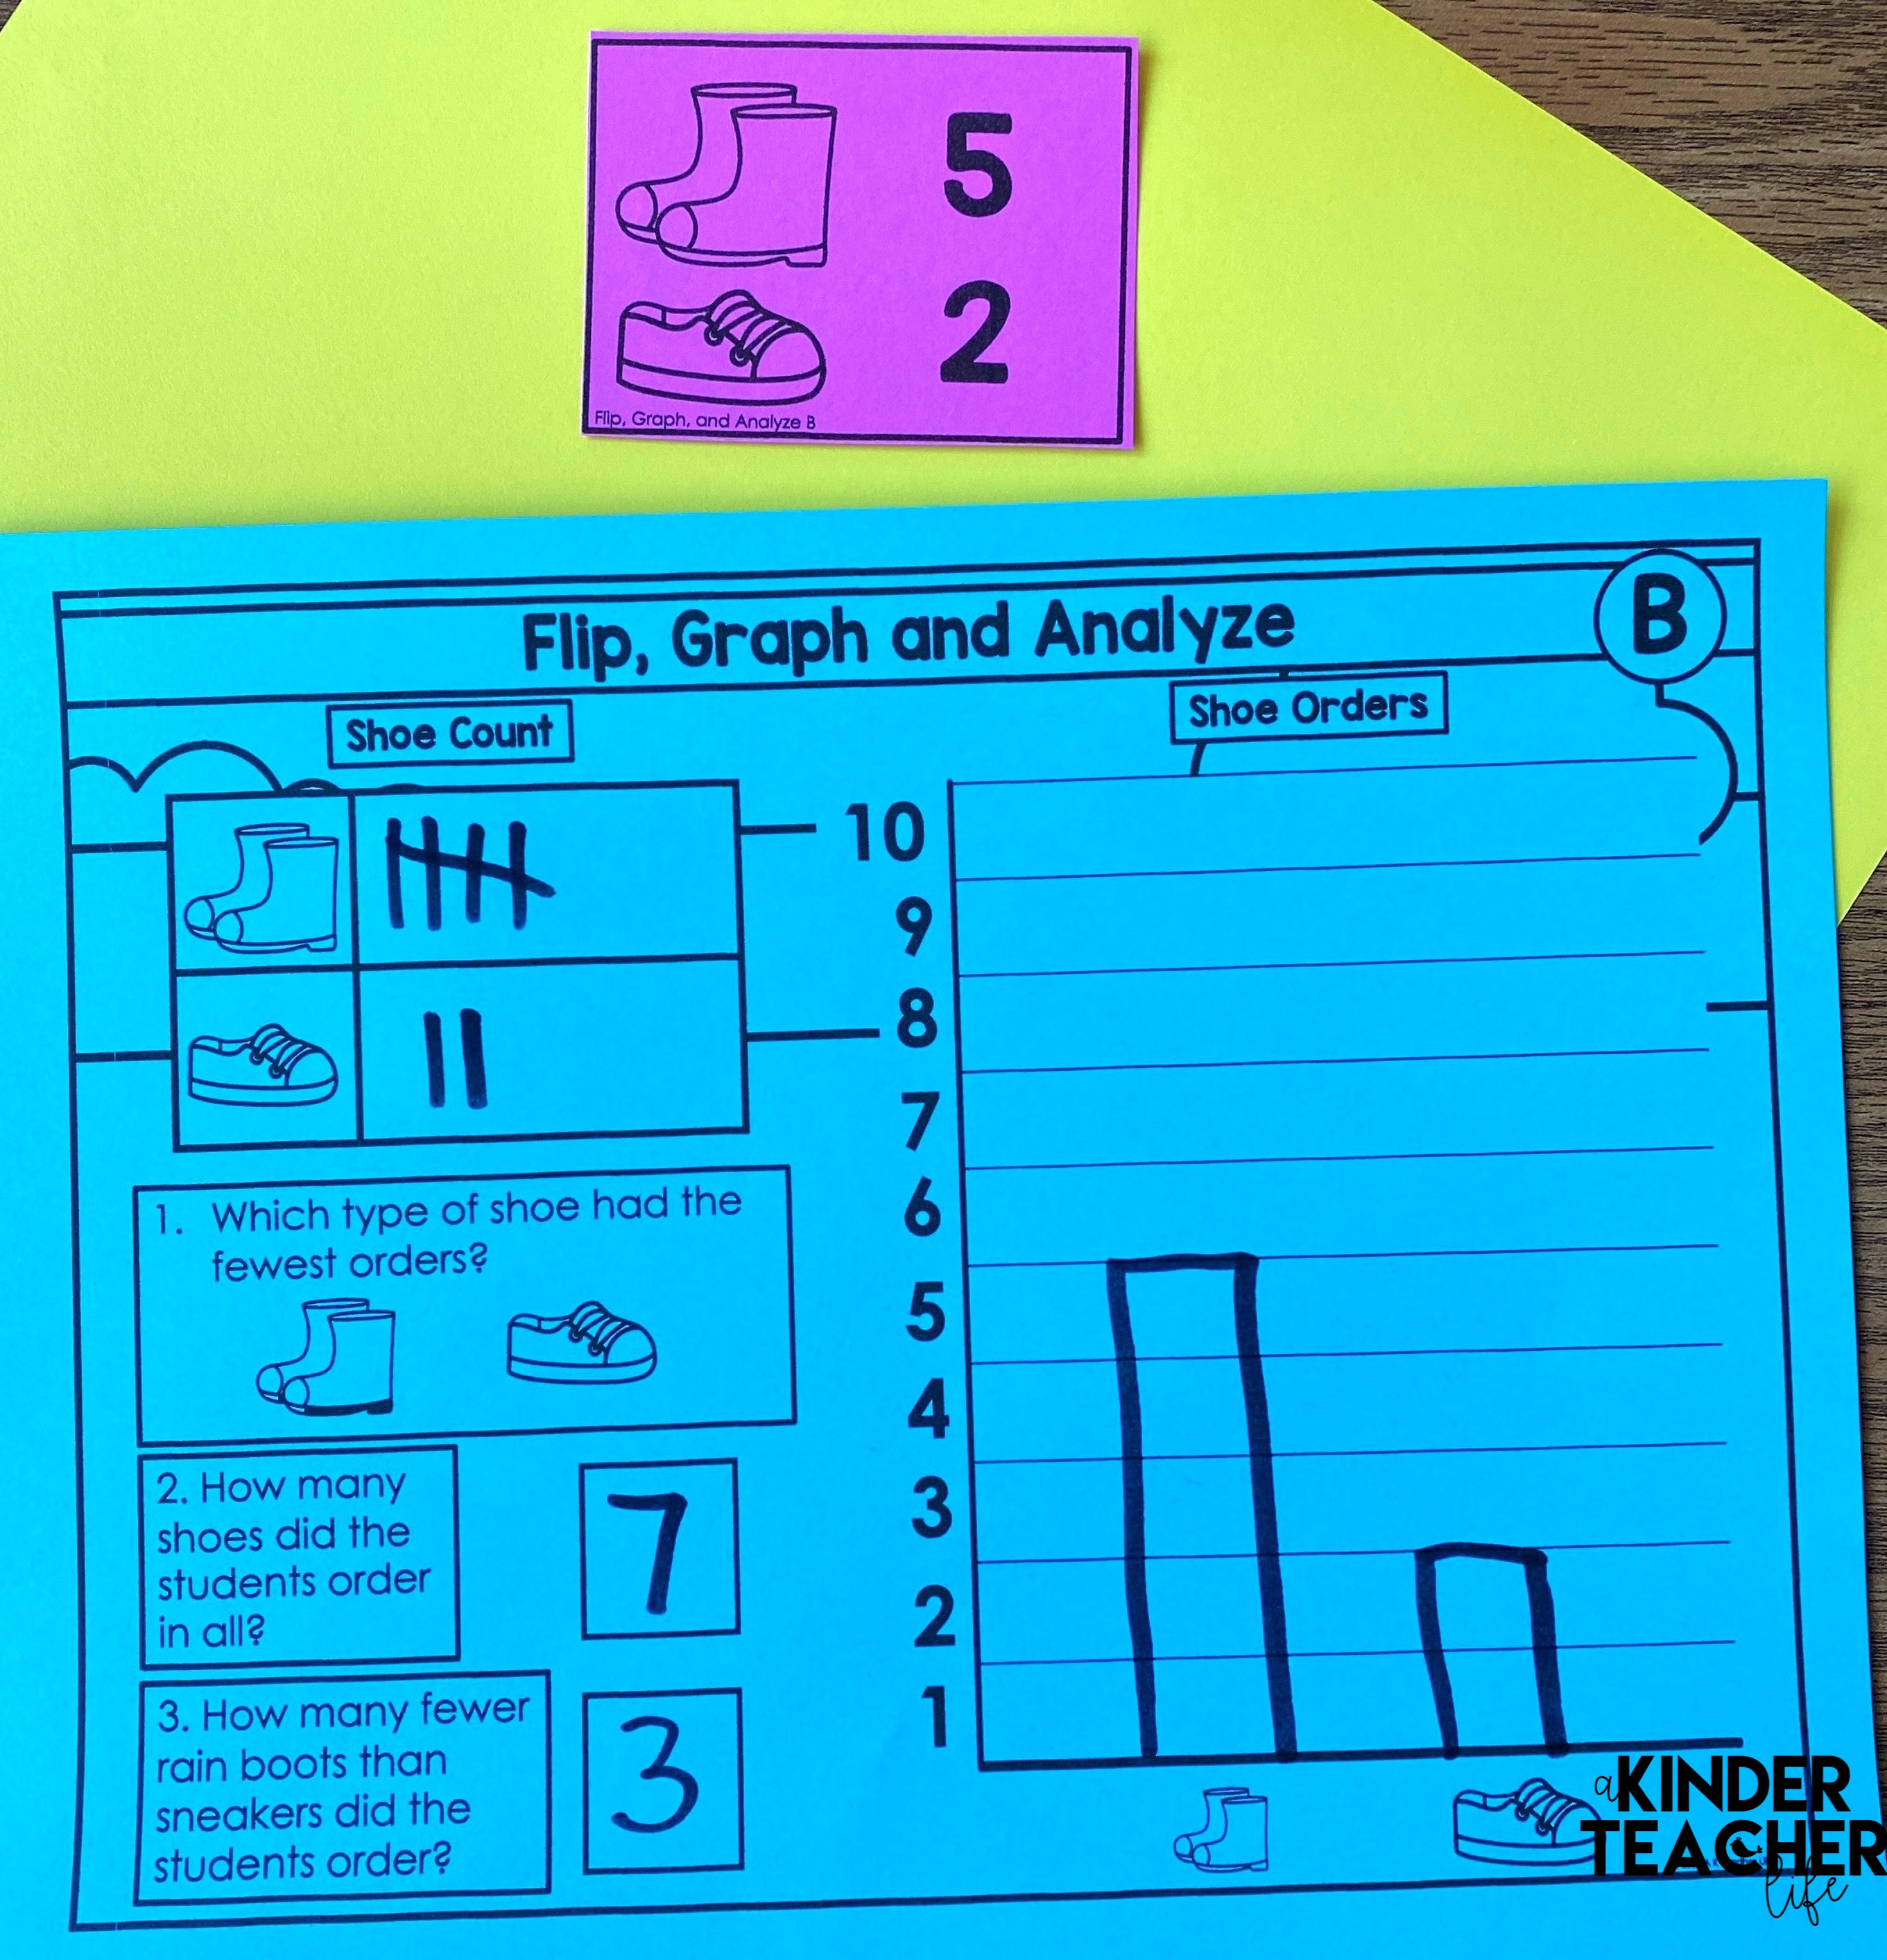
Flip, Graph, and Analyze: Shoe Orders
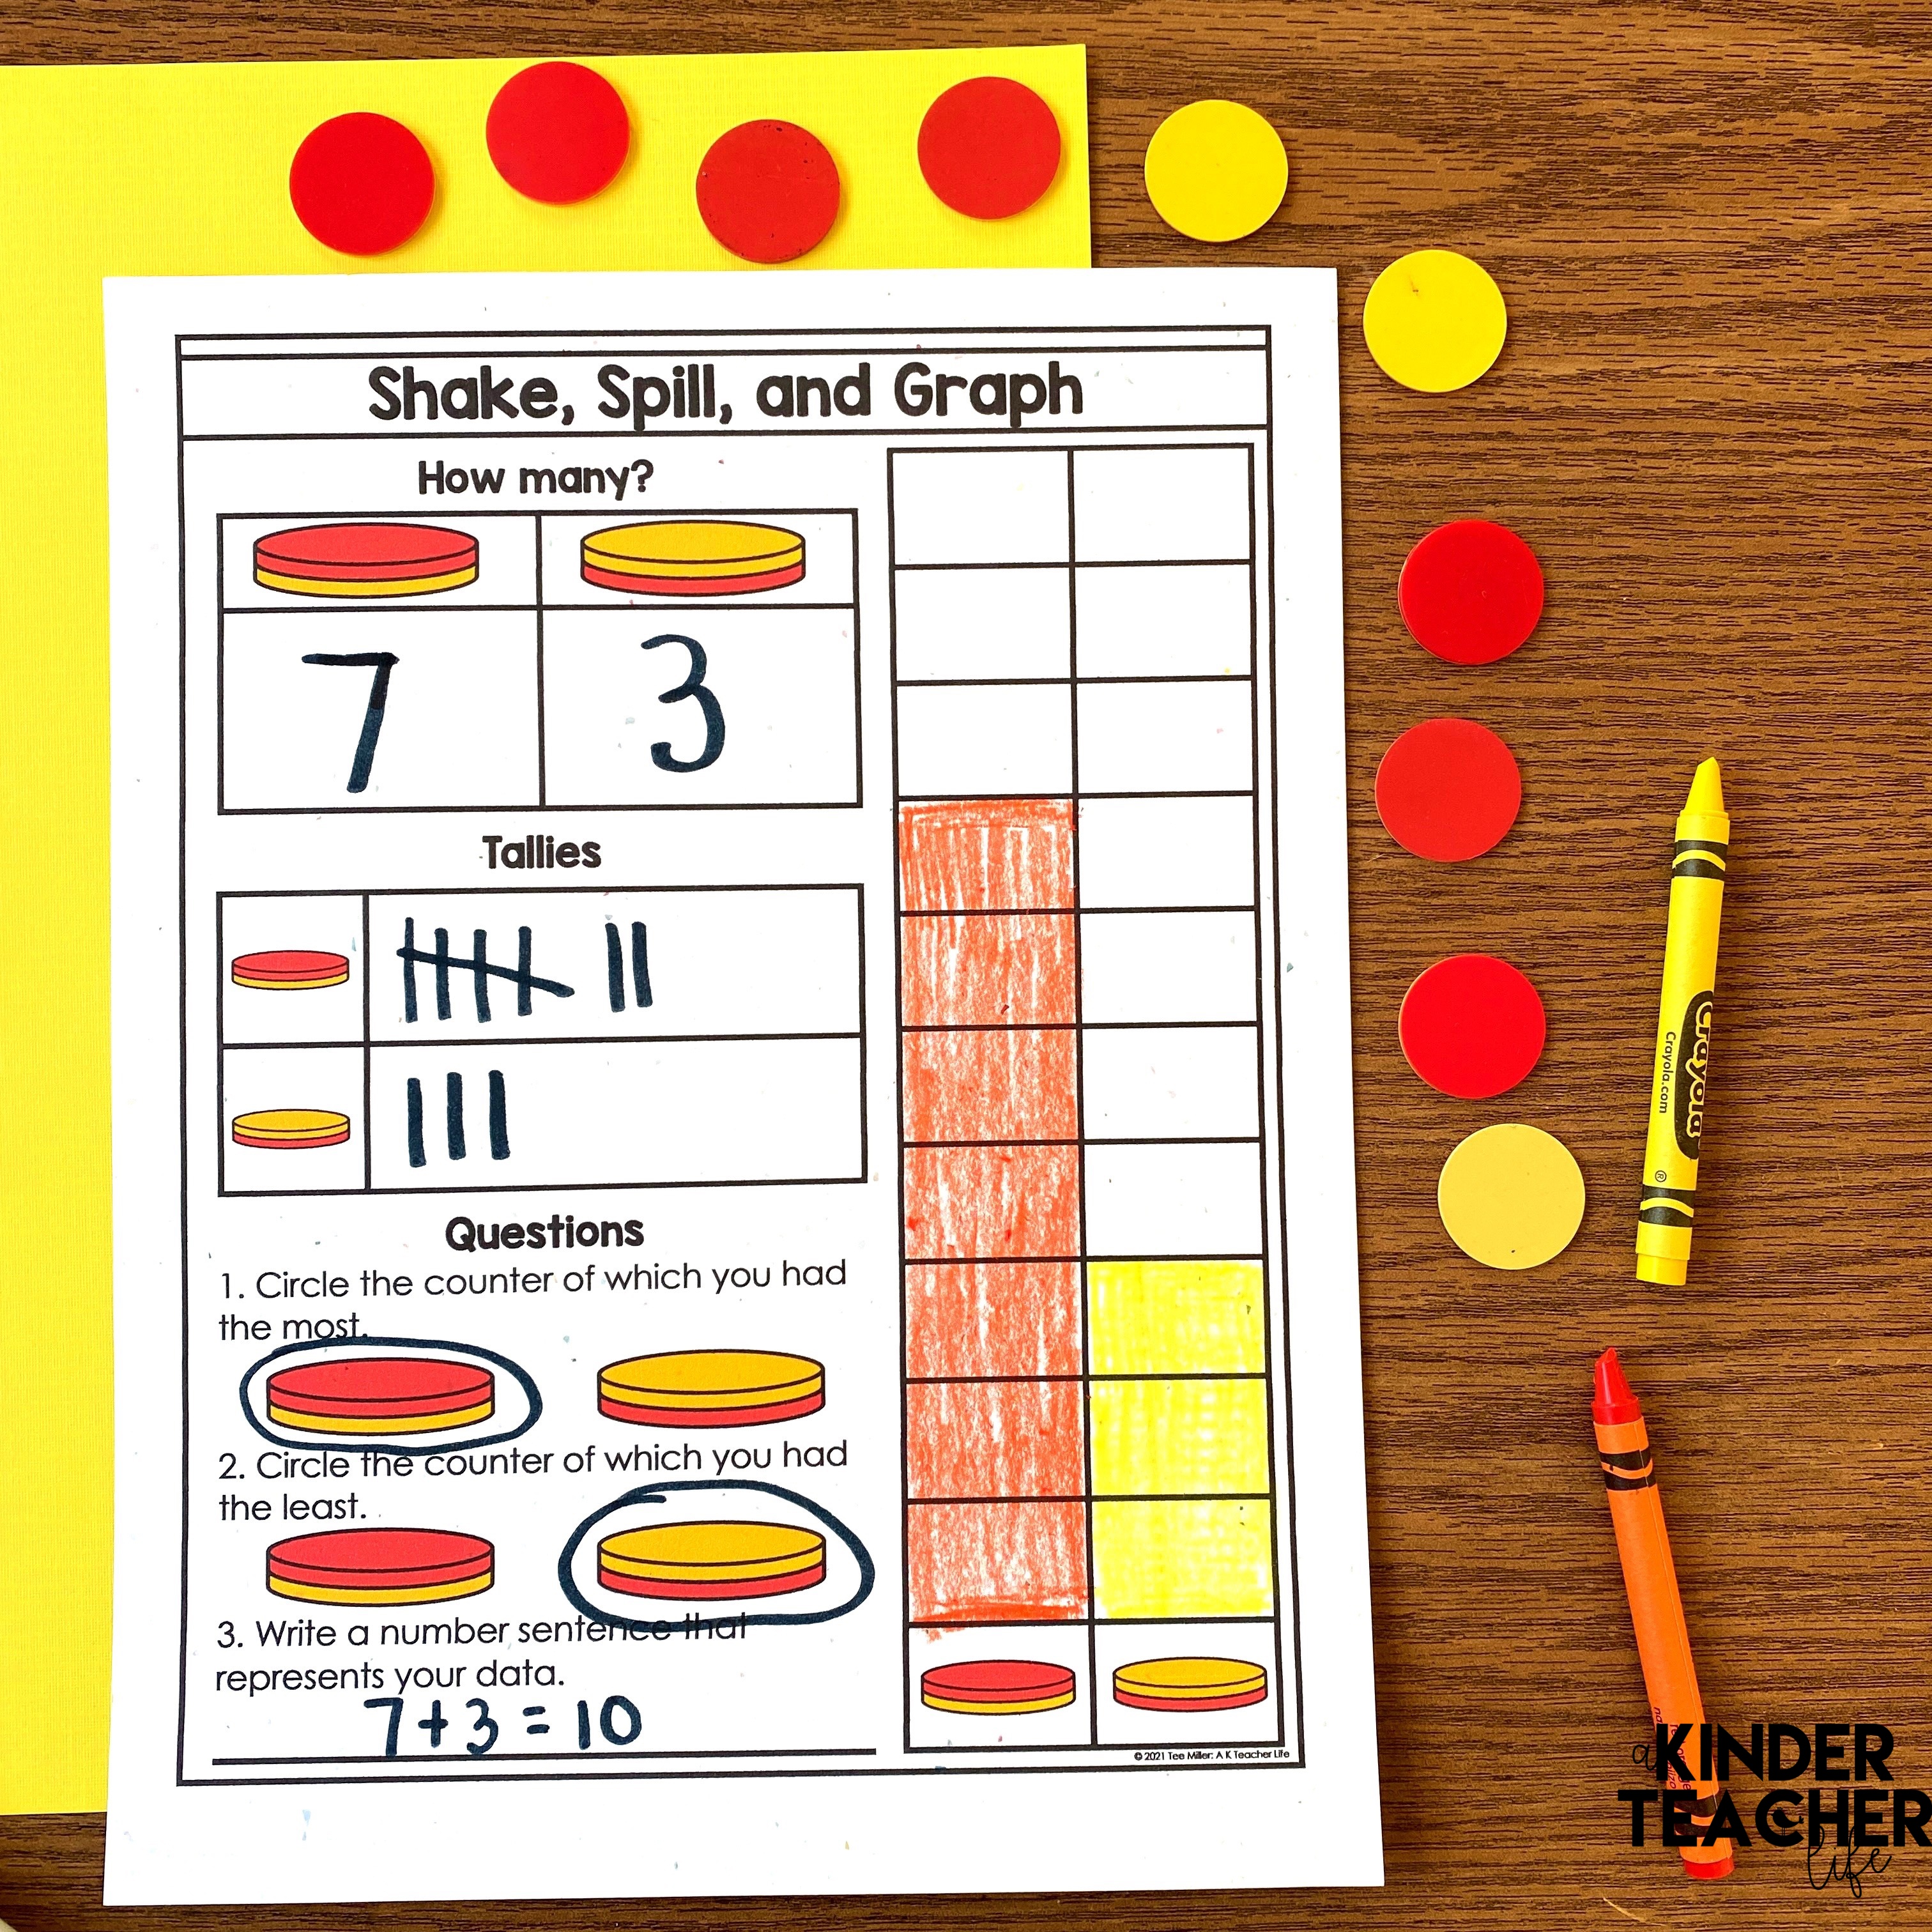
Shake, Spill, and Graph
I love shake and spill activities! In this version, students shake and spill two-colored counters, graph, and analyze the information.
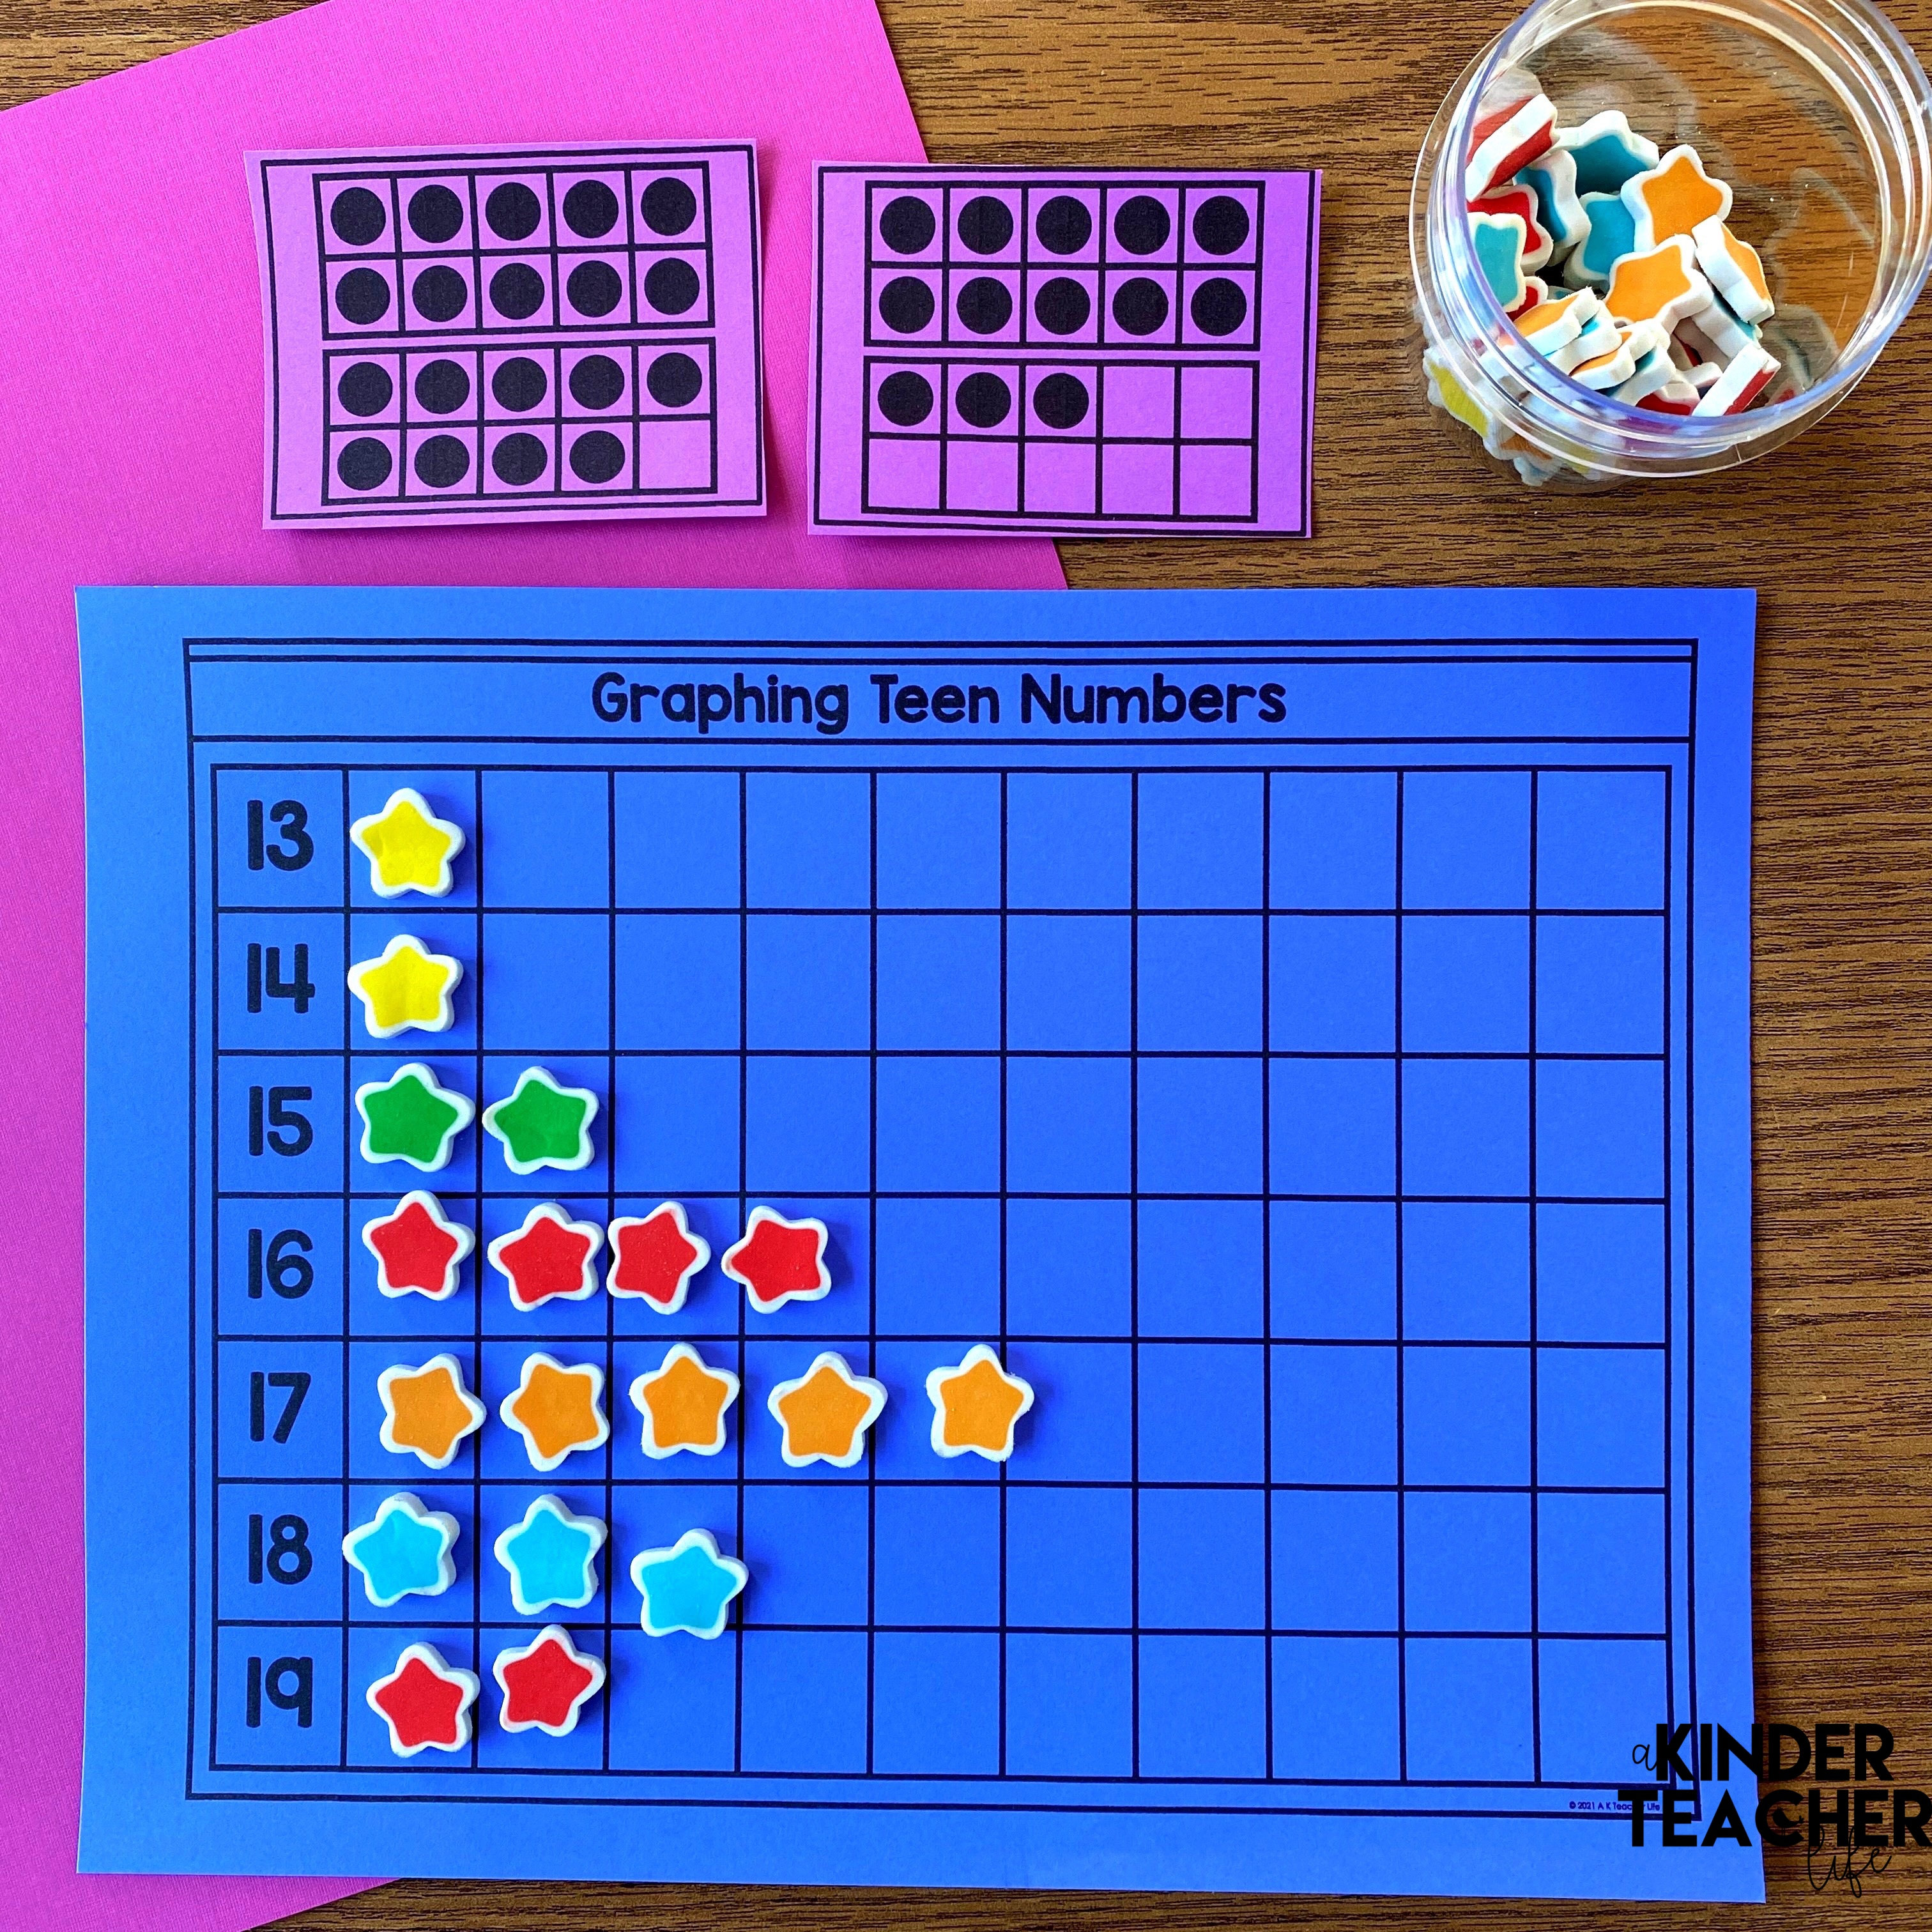
Graphing Teen Numbers
First, graph teen numbers on a bar graph. Next, ask a partner questions about the data collected. Last, the partner will answer them.
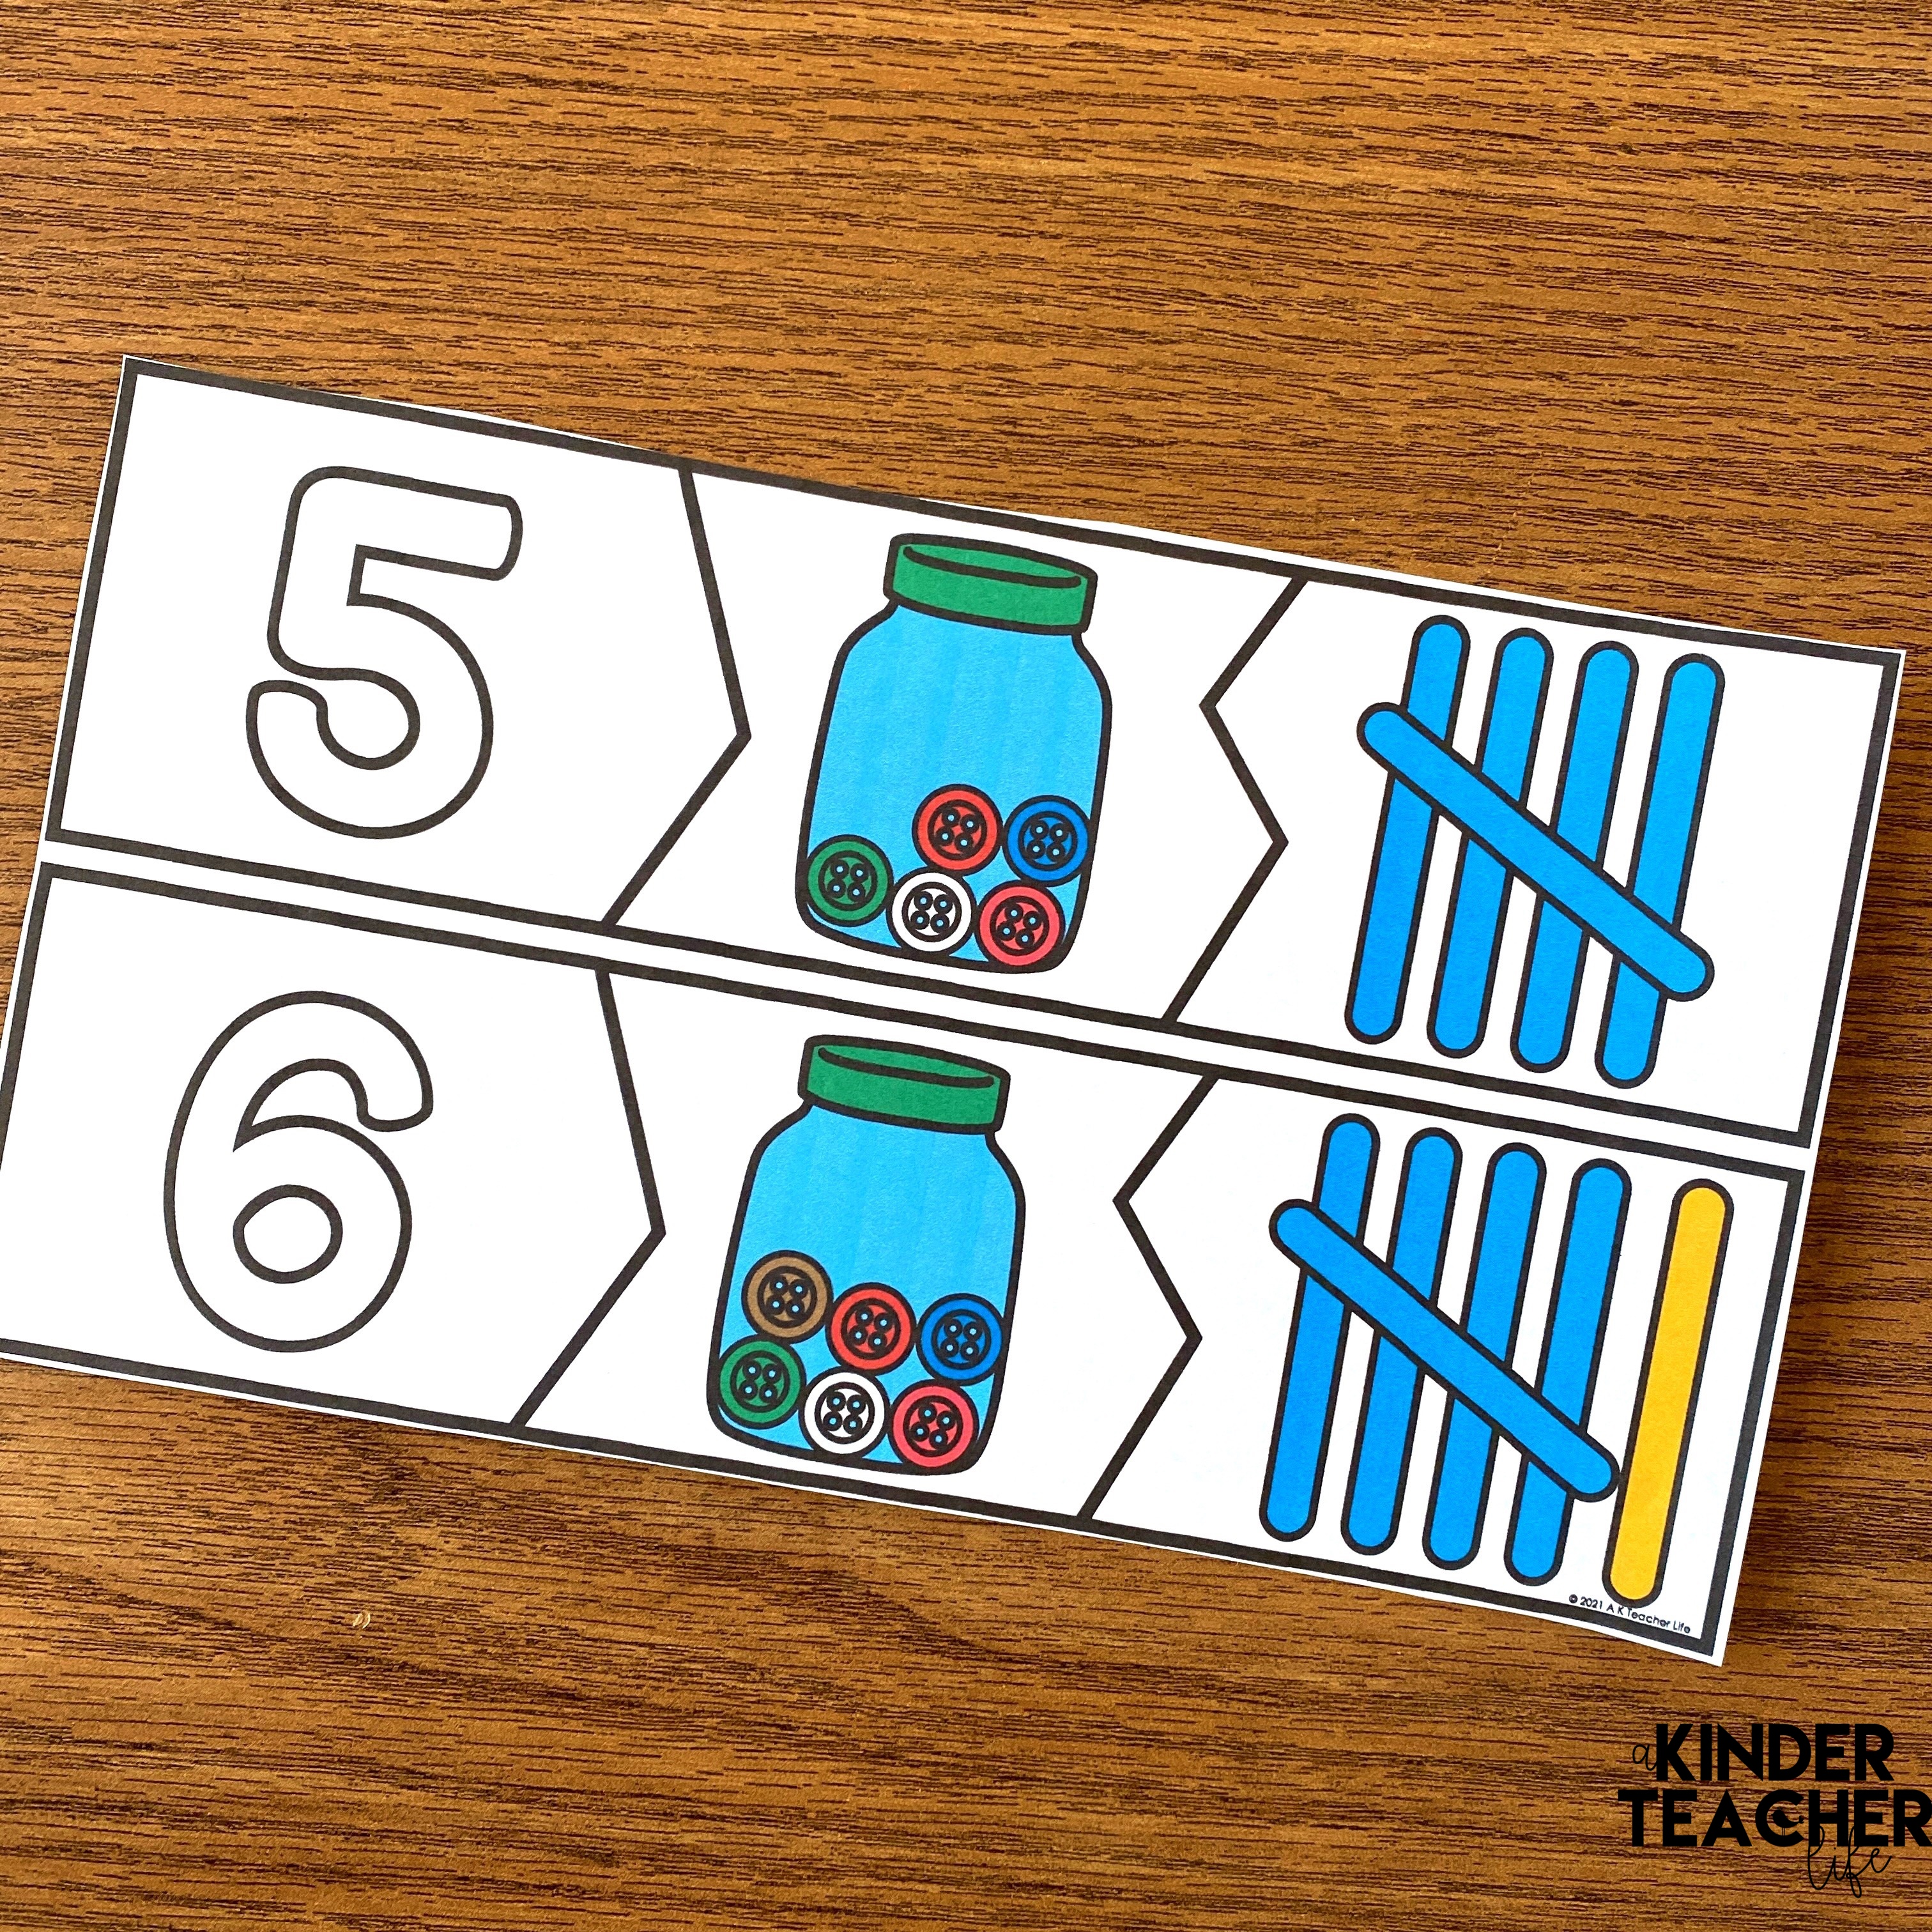
Tally Puzzle
Match the number, the picture, and the tallies.
Survey, Graph, and Analyze
First, students come up with a question to ask several peers. Then, they ask their question. Last, they graph and analyze the data they collected.
Graph and Analyze Data
Graph and analyze digital activity made for Google Classroom and Seesaw.
There are a ton of ways to teach students how to represent and interpret data. What activities do you use? Let me know in the comments section below.
Get these activities
You can grab all of these graphing activities by clicking the link below.

Graph and Data Math Center Freebie
You can never have too many math center activities. Here’s a freebie from my Graph and Data Math Center packet. You can grab this low-prep activity by completing the form below.
Click here for more hands-on math activities.
Happy Teaching,
Tee


One Comment